23 Jan , 2025 By : Debdeep Gupta

The Nifty 50 bounced back after a day of steep correction, rising 0.6 percent on January 22. However, considering the deterioration in market breadth and sharp selling pressure in the broader markets, along with the continuation of the lower tops-lower bottoms formation, there is an indication of weakness. The Nifty 50 seems to be in the broader range of 23,000–23,400 levels. Hence, if the index decisively breaks the upper range, renewed buying interest could lift the index toward 23,600. Conversely, breaking the lower range could take the index down toward 22,800, which is the near-term target on the downside, according to experts.
Here are 15 data points we have collated to help you spot profitable trades:
1) Key Levels For The Nifty 50 (23,155)
Resistance based on pivot points: 23,174, 23,218, and 23,290
Support based on pivot points: 23,030, 22,986, and 22,914
Special Formation: The Nifty 50 formed a small bullish candlestick pattern with a long lower shadow on the daily timeframe, indicating buying interest at lower levels. The index also defended the downward-sloping support trendline for another session, which is a positive sign. However, the overall trend remains under the control of bears, given that the index is trading below all key moving averages with a negative bias in momentum indicators.
2) Key Levels For The Bank Nifty (48,724)
Resistance based on pivot points: 48,797, 48,964, and 49,234
Support based on pivot points: 48,256, 48,089, and 47,819
Resistance based on Fibonacci retracement: 49,449, 50,415
Support based on Fibonacci retracement: 47,878, 46,078
Special Formation: The Bank Nifty recovered 650 points from the day's low to close with a gain of 153 points, forming a small-bodied bullish candlestick pattern with a long lower shadow, resembling a Dragonfly Doji-like candlestick pattern on the daily timeframe. This is a trend reversal pattern, raising the possibility of an upward trend. Furthermore, the index also defended the upward-sloping support trendline on a closing basis, which is another positive sign. Still, the overall sentiment remains negative, as the index traded well below all key moving averages.
3) Nifty Call Options Data
According to the weekly options data, the maximum Call open interest was seen at the 23,500 strike (with 1.06 crore contracts). This level can act as a key resistance for the Nifty in the short term. It was followed by the 24,000 strike (95.83 lakh contracts) and the 23,300 strike (89.58 lakh contracts).
Maximum Call writing was observed at the 23,300 strike, which saw an addition of 32.54 lakh contracts, followed by the 23,100 and 23,152 strikes, which added 23.68 lakh and 21.39 lakh contracts, respectively. The maximum Call unwinding was seen at the 24,000 strike which shed 24.23 lakh contracts, followed by the 24,100 and 23,750 strikes, which shed 5.31 lakh and 5.21 lakh contracts, respectively.
4) Nifty Put Options Data
On the Put side, the 23,000 strike holds the maximum Put open interest (with 1.04 crore contracts), which can act as a key support level for the Nifty. It was followed by the 23,100 strike (74.86 lakh contracts) and the 22,500 strike (56.89 lakh contracts).
The maximum Put writing was placed at the 23,000 strike, which saw an addition of 50.53 lakh contracts, followed by the 23,100 and 23,050 strikes, which added 46.61 lakh and 32.39 lakh contracts, respectively. The maximum Put unwinding was seen at the 22,400 strike, which shed 17.89 lakh contracts, followed by the 22,500 and 23,300 strikes, which shed 9.03 lakh and 4.82 lakh contracts, respectively.
5) Bank Nifty Call Options Data
According to the monthly options data, the maximum Call open interest was seen at the 50,000 strike, with 21.99 lakh contracts. This can act as a key resistance level for the index in the short term. It was followed by the 49,000 strike (15.38 lakh contracts) and the 49,500 strike (15.1 lakh contracts).
Maximum Call writing was visible at the 49,000 strike (with the addition of 2.9 lakh contracts), followed by the 49,500 strike (2.7 lakh contracts) and the 50,000 strike (2.4 lakh contracts). The maximum Call unwinding was seen at the 50,500 strike, which shed 42,900 contracts, followed by the 48,100 and 47,900 strikes, which shed 19,185 and 2,745 contracts, respectively.
6) Bank Nifty Put Options Data
On the Put side, the 47,000 strike holds the maximum Put open interest (with 14.62 lakh contracts), which can act as a key support level for the index. This was followed by the 48,000 strike (13.63 lakh contracts) and the 48,500 strike (9.83 lakh contracts).
The maximum Put writing was observed at the 47,500 strike (which added 1.23 lakh contracts), followed by the 48,600 strike (1.19 lakh contracts) and the 47,000 strike (1.08 lakh contracts). The maximum Put unwinding was seen at the 49,000 strike, which shed 75,855 contracts, followed by the 50,000 and 49,500 strikes which shed 75,030 and 54,045 contracts, respectively.
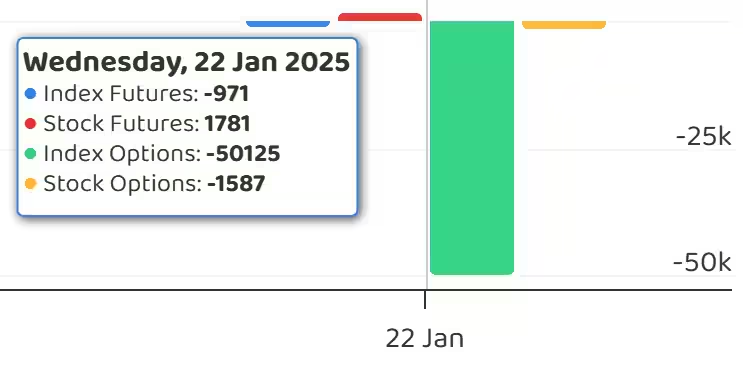
7) Funds Flow (Rs crore)
8) Put-Call Ratio
The Nifty Put-Call ratio (PCR), which indicates the mood of the market, climbed to 0.88 on January 22, from 0.77 level in the previous session.
The increasing PCR, or being higher than 0.7 or surpassing 1, means traders are selling more Put options than Call options, which generally indicates the firming up of a bullish sentiment in the market. If the ratio falls below 0.7 or moves towards 0.5, then it indicates selling in Calls is higher than selling in Puts, reflecting a bearish mood in the market.
9) India VIX
India VIX, the volatility index that measures expected market volatility, snapped four days of gains, falling 1.66 percent to 16.77. However, it remains in the higher zone, signaling caution for bulls.
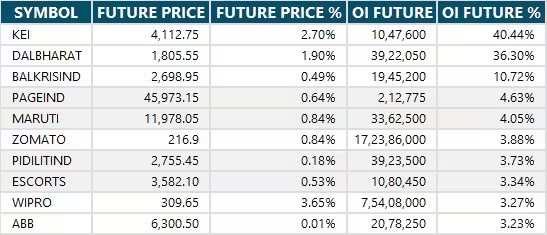
10) Long Build-up (50 Stocks)
A long build-up was seen in 50 stocks. An increase in open interest (OI) and price indicates a build-up of long positions.
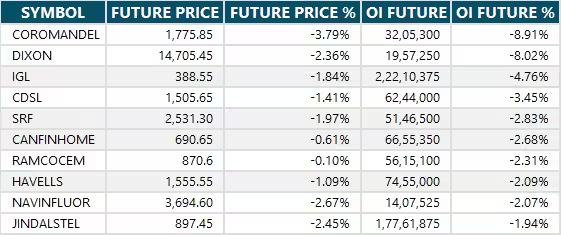
11) Long Unwinding (44 Stocks)
44 stocks saw a decline in open interest (OI) along with a fall in price, indicating long unwinding.
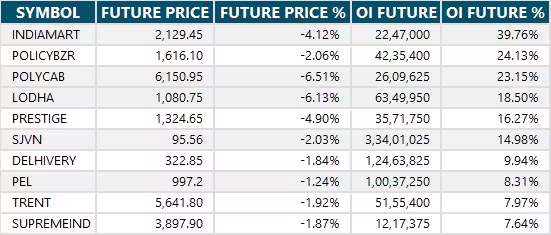
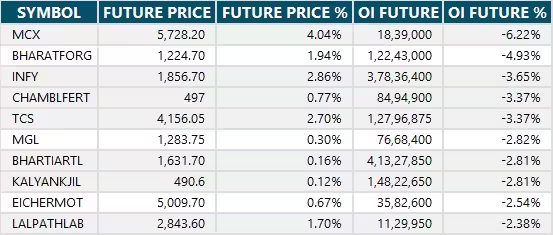
12) Short Build-up (101 Stocks)
101 stocks saw an increase in OI along with a fall in price, indicating a build-up of short positions.
13) Short-Covering (33 Stocks)
33 stocks saw short-covering, meaning a decrease in OI, along with a price increase.
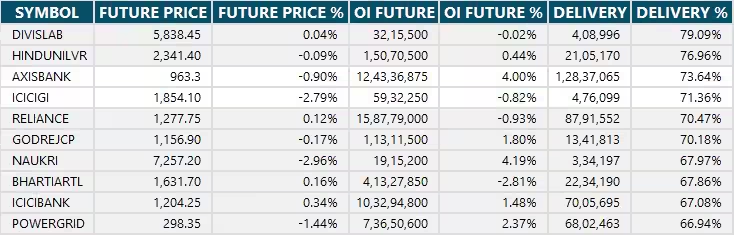
14) High Delivery Trades
Here are the stocks that saw a high share of delivery trades. A high share of delivery reflects investing (as opposed to trading) interest in a stock.
15) Stocks Under F&O Ban
Securities banned under the F&O segment include companies where derivative contracts cross 95 percent of the market-wide position limit.
Stocks added to F&O ban: IndiaMART InterMESH, Punjab National Bank
Stocks retained in F&O ban: Aditya Birla Fashion & Retail, Bandhan Bank, Can Fin Homes, Dixon Technologies, L&T Finance, Manappuram Finance, Mahanagar Gas, RBL Bank
Stocks removed from F&O ban: Angel One, Kalyan Jewellers


0 Comment