21 Mar , 2025 By : Debdeep Gupta

The market clocked more than a 1 percent gain after a gap-up opening and hit a more than five-week high on March 20, as bulls seemed to have fully charged with buying across sectors and a steep fall in India VIX. Considering the strong momentum for the fourth consecutive session, the index is likely to march toward 23,400, which coincides with the 100 and 200-day EMAs as well as the 78.6% Fibonacci retracement (23,807-21,965), in the upcoming sessions. However, if it consolidates, given the 860-point surge of the last four sessions, the immediate support zone is 23,100-23,000, according to experts.
Here are 15 data points we have collated to help you spot profitable trades:
1) Key Levels For The Nifty 50 (23,191)
Resistance based on pivot points: 23,220, 23,277, and 23,370
Support based on pivot points: 23,034, 22,977, and 22,884
Special Formation: The Nifty 50 reported a long bullish candle on the daily charts with above-average volumes, continuing the higher highs-higher lows formation for the third consecutive session. With Thursday's rally, the index climbed decisively above short- to medium-term moving averages, which is a positive sign. The momentum indicators also provided healthy support to the index, with the RSI rising to 63.04 and MACD trending higher with a positive bias (though it is still below the zero line).
2) Key Levels For The Bank Nifty (50,063)
Resistance based on pivot points: 50,143, 50,234, and 50,380
Support based on pivot points: 49,850, 49,759, and 49,613
Resistance based on Fibonacci retracement: 50,287, 51,085
Support based on Fibonacci retracement: 49,284, 47,872
Special Formation: The Bank Nifty entered into a healthy zone by surpassing all key moving averages (10, 20, 50, 100, and 200-day EMAs) on Thursday, continuing its uptrend and higher tops-higher bottoms for the sixth straight session. The index gained 360 points and formed a bullish candlestick pattern with a minor upper shadow and a sizeable lower shadow on the daily timeframe, indicating buying interest at lower levels, though there was some selling pressure at higher levels. The RSI reached to 64.19 zone, while the MACD is trending higher and approaching the zero line, signaling a positive bias.
3) Nifty Call Options Data
According to the monthly options data, the 24,000 strike holds the maximum Call open interest (with 1.05 crore contracts). This level can act as a key resistance for the Nifty in the short term. It was followed by the 23,500 strike (77.63 lakh contracts), and the 23,000 strike (75.38 lakh contracts).
Maximum Call writing was observed at the 24,000 strike, which saw an addition of 47.58 lakh contracts, followed by the 23,900 and 24,100 strikes, which added 42.18 lakh and 38.47 lakh contracts, respectively. The maximum Call unwinding was seen at the 22,900 strike, which shed 3.92 lakh contracts, followed by the 22,800 and 22,700 strikes, which shed 3.55 lakh and 2.64 lakh contracts, respectively.
4) Nifty Put Options Data
On the Put side, the maximum Put open interest was seen at the 23,000 strike (with 92.88 lakh contracts), which can act as a key support level for the Nifty. It was followed by the 22,500 strike (88.17 lakh contracts) and the 22,800 strike (69.13 lakh contracts).
The maximum Put writing was placed at the 23,000 strike, which saw an addition of 57.3 lakh contracts, followed by the 23,200 and 23,100 strikes, which added 41.97 lakh and 37.59 lakh contracts, respectively. The maximum Put unwinding was seen at the 23,900 strike, which shed 89,550 contracts, followed by the 23,700 and 24,000 strikes, which shed 65,550 and 62,025 contracts, respectively.
5) Bank Nifty Call Options Data
According to the monthly options data, the maximum Call open interest was seen at the 52,000 strike, with 16.46 lakh contracts. This can act as a key resistance level for the index in the short term. It was followed by the 51,000 strike (14.64 lakh contracts) and the 50,000 strike (13.43 lakh contracts).
Maximum Call writing was visible at the 50,100 strike (with the addition of 2.22 lakh contracts), followed by the 50,200 strike (1.62 lakh contracts) and the 51,600 strike (1.59 lakh contracts). The maximum Call unwinding was seen at the 49,000 strike, which shed 1.66 lakh contracts, followed by the 49,700 and 49,500 strikes, which shed 1.13 lakh and 1.01 lakh contracts, respectively.
6) Bank Nifty Put Options Data
On the Put side, the 49,000 strike holds the maximum Put open interest (with 21.93 lakh contracts), which can act as a key support level for the index. This was followed by the 48,000 strike (19.77 lakh contracts) and the 48,500 strike (14.03 lakh contracts).
The maximum Put writing was observed at the 50,000 strike (which added 5.78 lakh contracts), followed by the 50,100 strike (2.14 lakh contracts) and the 49,900 strike (1.88 lakh contracts). The maximum Put unwinding was seen at the 48,700 strike, which shed 1.1 lakh contracts, followed by the 48,200 and 49,200 strikes which shed 52,050 and 34,500 contracts, respectively.
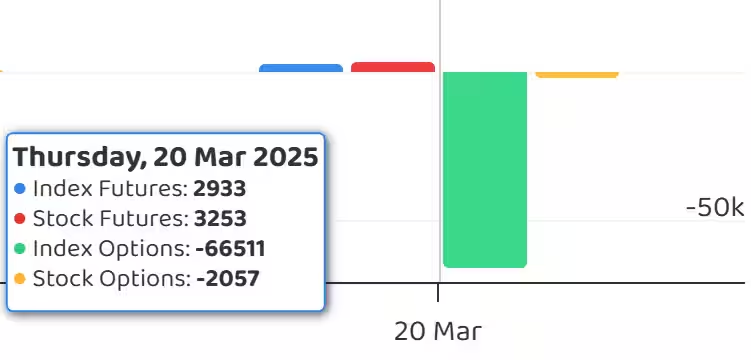
7) Funds Flow (Rs crore)
8) Put-Call Ratio
The Nifty Put-Call ratio (PCR), which indicates the mood of the market, dropped to 1.16 on March 20, against 1.2 in the previous session.
The increasing PCR, or being higher than 0.7 or surpassing 1, means traders are selling more Put options than Call options, which generally indicates the firming up of a bullish sentiment in the market. If the ratio falls below 0.7 or moves towards 0.5, then it indicates selling in Calls is higher than selling in Puts, reflecting a bearish mood in the market.
9) India VIX
The India VIX, the fear factor, declined by 5.23% to 12.60, the lowest closing level since October 1, 2024, which is more favourable for bulls.
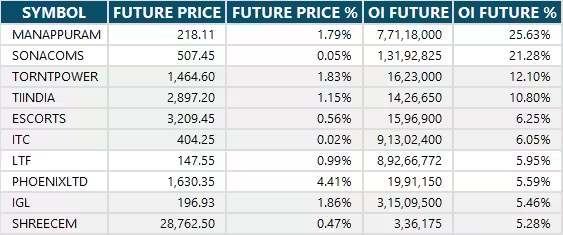
10) Long Build-up (71 Stocks)
A long build-up was seen in 71 stocks. An increase in open interest (OI) and price indicates a build-up of long positions.
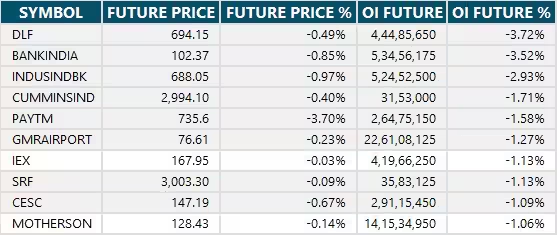
11) Long Unwinding (20 Stocks)
20 stocks saw a decline in open interest (OI) along with a fall in price, indicating long unwinding.
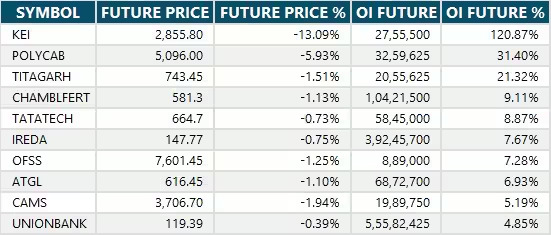
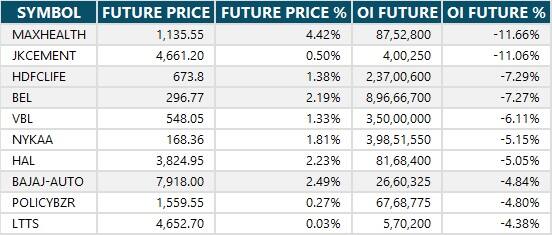
12) Short Build-up (42 Stocks)
42 stocks saw an increase in OI along with a fall in price, indicating a build-up of short positions.
13) Short-Covering (84 Stocks)
84 stocks saw short-covering, meaning a decrease in OI, along with a price increase.
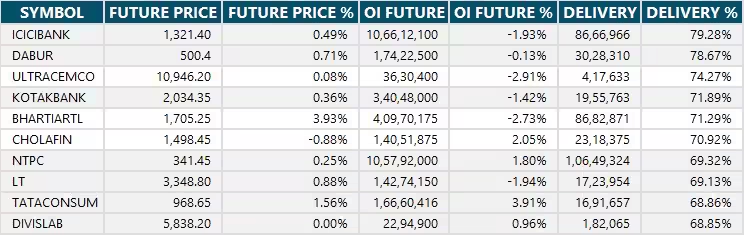
14) High Delivery Trades
Here are the stocks that saw a high share of delivery trades. A high share of delivery reflects investing (as opposed to trading) interest in a stock.
15) Stocks Under F&O Ban
Securities banned under the F&O segment include companies where derivative contracts cross 95 percent of the market-wide position limit.
Stocks added to F&O ban: Manappuram Finance, Polycab India,
Stocks retained in F&O ban: Hindustan Copper, IndusInd Bank, SAIL
Stocks removed from F&O ban: Nil


0 Comment