02 Feb , 2026 By : Debdeep Gupta

The Nifty 50 recorded a 2 percent loss on February 1 as bears tightened their grip on the market following the Union Budget, which disappointed traders by increasing the Securities Transaction Tax (STT) on futures and options. The index slipped decisively below the 200-day EMA—the last key EMA support—and hit a five-month low, with momentum indicators flashing sell signals. If the index manages to defend Sunday’s low of 24,572 (from where it recovered over 250 points before closing), a rebound toward the 25,000–25,160 resistance zone is possible and could signal the formation of a bottom. However, a breakdown below this level could open the door to the 24,500–24,400 zone, which is the next crucial support area, according to experts.
Here are 15 data points we have collated to help you spot profitable trades:
1) Key Levels For The Nifty 50 (24,825)
Resistance based on pivot points: 25,278, 25,483, and 25,815
Support based on pivot points: 24,614, 24,409, and 24,077
Special Formation: The Nifty 50 formed a long bearish candle with a minor upper shadow and a long lower shadow on the daily charts, indicating strong selling pressure amid heightened volatility. The index traded below all key moving averages, with short- and medium-term averages trending downward, while also touching the lower Bollinger Band. Momentum indicators continued to signal weakness. The RSI slipped to 30.93, falling below its signal line, while the MACD remained below both the reference line and the zero line, with the histogram indicating further weakness. All these factors indicate a strong bearish bias in the near term.
2) Key Levels For The Bank Nifty (58,417)
Resistance based on pivot points: 59,484, 59,976, and 60,771
Support based on pivot points: 57,893, 57,402, and 56,606
Resistance based on Fibonacci retracement: 59,871, 60,438
Support based on Fibonacci retracement: 57,795, 56,982
Special Formation: Similar price action and candle formation were also observed in the Bank Nifty. The banking index slipped below its 10-, 20-, and 50-day EMAs and tested the 100-day EMA within a single session. The RSI turned bearish, declining to 41.16, while the Stochastic RSI also moved into negative territory. Additionally, the MACD remained below the zero and reference lines, with weakness visible in the histogram. These signals collectively point to continued pressure in the banking space.
3) Nifty Call Options Data
According to the weekly options data, the 25,500 strike holds the maximum Call open interest (with 1.61 crore contracts). This level can act as a key resistance level for the Nifty in the short term. It was followed by the 25,400 strike (1.15 crore contracts) and 25,300 strike (1.08 crore contracts).
Maximum Call writing was observed at the 25,500 strike, which saw an addition of 94.96 lakh contracts, followed by the 25,000 and 25,400 strikes, which added 77.7 lakh and 71.38 lakh contracts, respectively. There was hardly any Call unwinding seen in the 24,100-25,600 strike band.
4) Nifty Put Options Data
On the Put side, the maximum Put open interest was seen at the 24,500 strike (with 65.91 lakh contracts), which can act as a key support level for the Nifty in the short term. It was followed by the 25,000 strike (49.07 lakh contracts) and the 24,300 strike (40.7 lakh contracts).
The maximum Put writing was placed at the 24,100 strike, which saw an addition of 23.46 lakh contracts, followed by the 24,700 and 24,400 strikes, which added 14.52 lakh and 12.85 lakh contracts, respectively. The maximum Put unwinding was seen at the 25,300 strike, which shed 27 lakh contracts, followed by the 24,900 and 25,200 strikes, which shed 24.92 lakh and 22.37 lakh contracts, respectively.
5) Bank Nifty Call Options Data
According to the monthly options data, the 60,000 strike holds the maximum Call open interest, with 18.02 lakh contracts. This can act as a key resistance level for the index in the short term. It was followed by the 59,000 strike (4.7 lakh contracts) and the 60,500 strike (4.09 lakh contracts).
Maximum Call writing was observed at the 59,000 strike (with the addition of 1.84 lakh contracts), followed by the 60,000 strike (1.49 lakh contracts) and 58,500 strike (1.07 lakh contracts). The maximum Call unwinding was seen at the 60,100 strike, which shed 41,610 contracts, followed by the 60,200 and 60,700 strikes which shed 13,560 and 8,790 contracts, respectively.
6) Bank Nifty Put Options Data
On the Put side, the maximum Put open interest was seen at the 60,000 strike (with 14.7 lakh contracts), which can act as a key level for the index. This was followed by the 58,000 strike (6.59 lakh contracts) and the 58,500 strike (6 lakh contracts).
The maximum Put writing was placed at the 57,000 strike (which added 40,230 contracts), followed by the 57,500 strike (27,720 contracts) and the 58,700 strike (24,720 contracts). The maximum Put unwinding was seen at the 59,500 strike, which shed 1.49 lakh contracts, followed by the 60,000 and 59,600 strikes, which shed 1.05 lakh and 42,870 contracts, respectively.
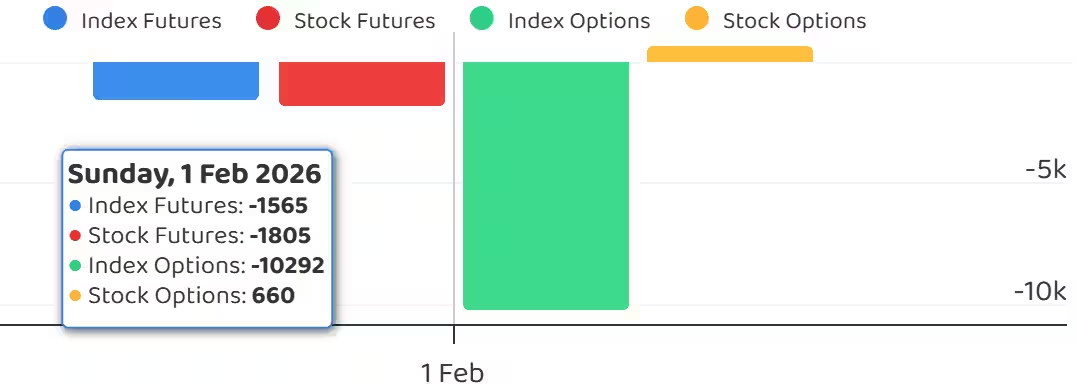
7) Funds Flow (Rs crore)
8) Put-Call Ratio
The Nifty Put-Call ratio (PCR), which indicates the mood of the market, dropped sharply to 0.59 (the lowest closing level since December 18, 2024) on February 1, compared to 0.9 in the previous session.
The increasing PCR, or being higher than 0.7 or surpassing 1, means traders are selling more Put options than Call options, which generally indicates the firming up of a bullish sentiment in the market. If the ratio falls below 0.7 or moves towards 0.5, then it indicates selling in Calls is higher than selling in Puts, reflecting a bearish mood in the market.
9) India VIX
The market’s fear gauge, the India VIX, surged 10.73 percent to 15.1, marking its highest closing level since June 4, 2025. The VIX remained well above all key moving averages, signalling heightened uncertainty and caution for bulls. The elevated volatility remains a major concern for the market in the near term.
10) Long Build-up (12 Stocks)
A long build-up was seen in 12 stocks. An increase in open interest (OI) and price indicates a build-up of long positions.
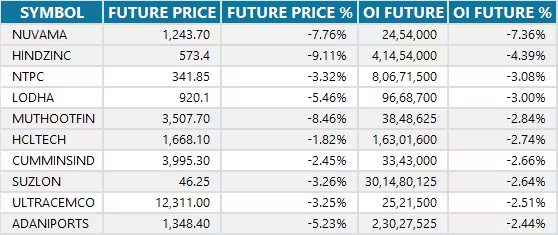
11) Long Unwinding (96 Stocks)
96 stocks saw a decline in open interest (OI) along with a fall in price, indicating long unwinding.
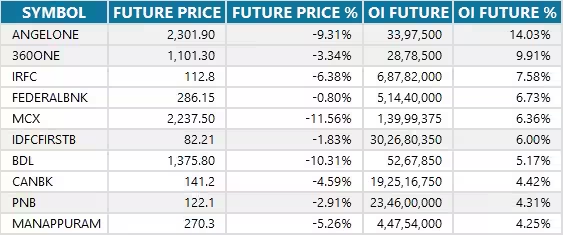
12) Short Build-up (81 Stocks)
81 stocks saw an increase in OI along with a fall in price, indicating a build-up of short positions.
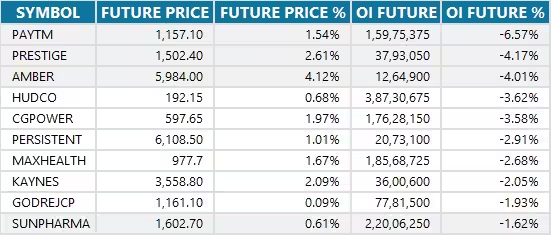
13) Short-Covering (21 Stocks)
21 stocks saw short-covering, meaning a decrease in OI, along with a price increase.
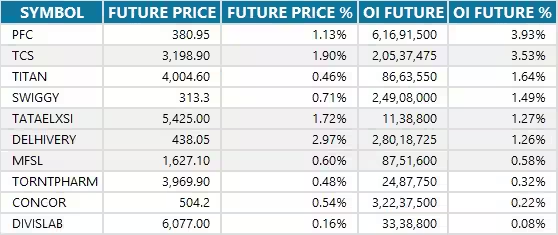
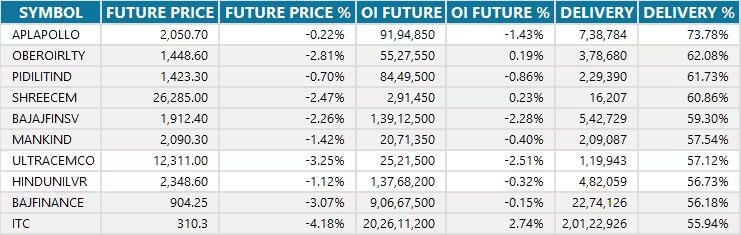
14) High Delivery Trades
Here are the stocks that saw a high share of delivery trades. A high share of delivery reflects investing (as opposed to trading) interest in a stock.
15) Stocks Under F&O Ban
Securities banned under the F&O segment include companies where derivative contracts cross 95 percent of the market-wide position limit.
Stocks added to F&O ban: Nil
Stocks retained in F&O ban: Sammaan Capital
Stocks removed from F&O ban: Nil


0 Comment