05 Sep , 2025 By : Debdeep Gupta

The Nifty 50 lost nearly 250 points from near 25,000 on profit booking and closed with moderate gains on September 4. The trend is expected to turn stronger if the index sustains above the 20- and 50-day EMAs, as it has already traded above the midline of the Bollinger Bands and the 100-day EMA for another session. During the day, the index managed to defend the 24,700 level, which is expected to act as immediate support. If this level is breached, a fall towards the 24,500–24,400 zone can't be ruled out. On the higher side, the 25,000 level is likely to be a key decisive zone for any upward movement toward 25,500, according to experts.
Here are 15 data points we have collated to help you spot profitable trades:
1) Key Levels For The Nifty 50 (24,734)
Resistance based on pivot points: 24,912, 24,976, and 25,080
Support based on pivot points: 24,704, 24,639, and 24,535
Special Formation: The Nifty 50 formed a long bearish candle on the daily timeframe, resembling Bearish Belt Hold and Bearish Meeting Line candlestick patterns, both signalling a negative trend. The index also traded below the 50-day EMA and near the 20-day EMA, but continued to hold above the midline of the Bollinger Bands and the 100-day EMA. The RSI stood at 49.09, showing a positive crossover. The MACD also gave a bullish crossover, with the histogram turning positive. The Stochastic RSI sustained its positive crossover. These indicators suggest that while the overall trend appears cautious due to the bearish candlestick patterns, underlying momentum is trying to turn positive.
2) Key Levels For The Bank Nifty (54,075)
Resistance based on pivot points: 54,349, 54,462, and 54,645
Support based on pivot points: 53,983, 53,870, and 53,687
Resistance based on Fibonacci retracement: 54,521, 55,115
Support based on Fibonacci retracement: 53,412, 52,415
Special Formation: The Bank Nifty also gave up early gains and closed just 8 points higher, forming a bearish candle on the daily chart. The index remained below the 20-, 50-, and 100-day EMAs, but continued to trade well above the 200-day EMA (placed at 53,587). It tested the 38.2% Fibonacci retracement level at 54,400 (measured from the April low to the July high), but failed to sustain above it. The RSI stood at 37.28, remaining below its signal line. The MACD also maintained its negative crossover, with the histogram below the zero line. These indicators reflect ongoing weakness and lack of momentum in the Bank Nifty.
3) Nifty Call Options Data
According to the weekly options data, the maximum Call open interest was seen at the 25,000 strike (with 1.79 crore contracts). This level can act as a key resistance for the Nifty in the short term. It was followed by the 24,900 strike (1.45 crore contracts), and the 25,500 strike (1.32 crore contracts).
Maximum Call writing was observed at the 24,900 strike, which saw an addition of 95.28 lakh contracts, followed by the 25,000 and 25,500 strikes, which added 89.93 lakh and 57.89 lakh contracts, respectively. The maximum Call unwinding was seen at the 24,600 strike, which shed 11.29 lakh contracts, followed by the 24,700 and 24,650 strikes, which shed 10.49 lakh and 7.44 lakh contracts, respectively.
4) Nifty Put Options Data
On the Put side, the 24,500 strike holds the maximum Put open interest (with 1.26 crore contracts), which can act as a key support level for the Nifty. It was followed by the 24,000 strike (1.03 crore contracts) and the 24,600 strike (86.41 lakh contracts).
The maximum Put writing was placed at the 24,800 strike, which saw an addition of 18.43 lakh contracts, followed by the 24,000 and 24,900 strikes, which added 16.63 lakh and 14.76 lakh contracts, respectively. The maximum Put unwinding was seen at the 24,550 strike, which shed 12.52 lakh contracts, followed by the 24,600 and 24,100 strikes, which shed 8.5 lakh and 8.19 lakh contracts, respectively.
5) Bank Nifty Call Options Data
According to the monthly options data, the 56,000 strike holds the maximum Call open interest, with 12.9 lakh contracts. This can act as a key resistance level for the index in the short term. It was followed by the 55,000 strike (12.75 lakh contracts) and the 54,000 strike (9.55 lakh contracts).
Maximum Call writing was observed at the 54,300 strike (with the addition of 87,010 contracts), followed by the 56,000 strike (68,390 contracts), and the 54,200 strike (57,680 contracts). The maximum Call unwinding was seen at the 54,000 strike, which shed 1.01 lakh contracts, followed by 53,500 and 53,900 strikes, which shed 25,585 and 27,650 contracts, respectively.
6) Bank Nifty Put Options Data
On the Put side, the maximum Put open interest was seen at the 54,000 strike (with 12.72 lakh contracts), which can act as a key support level for the index. This was followed by the 53,000 strike (8.75 lakh contracts) and the 52,500 strike (7.11 lakh contracts).
The maximum Put writing was observed at the 53,500 strike (which added 48,370 contracts), followed by the 52,500 strike (38,530 contracts) and the 54,200 strike (38,080 contracts). The maximum Put winding was seen at the 53,700 strike, which shed 45,605 contracts, followed by the 54,000 and 53,800 strikes, which shed 38,090 and 37,730 contracts, respectively.
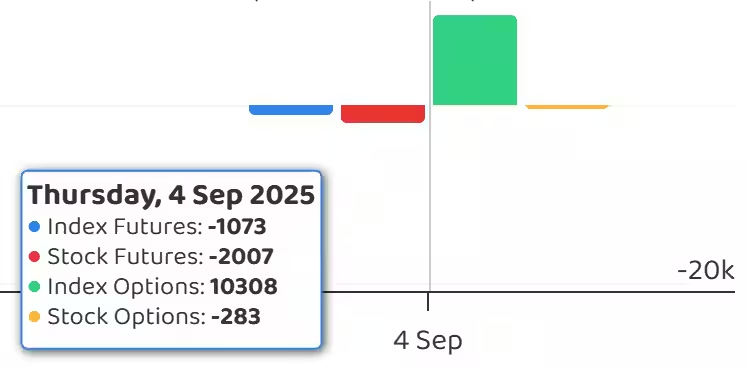
7) Funds Flow (Rs crore)
8) Put-Call Ratio
The Nifty Put-Call ratio (PCR), which indicates the mood of the market, fell sharply to 0.84 on September 04, compared to 1.21 in the previous session.
The increasing PCR, or being higher than 0.7 or surpassing 1, means traders are selling more Put options than Call options, which generally indicates the firming up of a bullish sentiment in the market. If the ratio falls below 0.7 or moves towards 0.5, then it indicates selling in Calls is higher than selling in Puts, reflecting a bearish mood in the market.
9) India VIX
The India VIX, the fear index, extended its downtrend for another session, falling 0.71 percent to 10.85, marking a fresh six-week low. It also continued to sustain below all key moving averages, which is considered favourable for bulls.
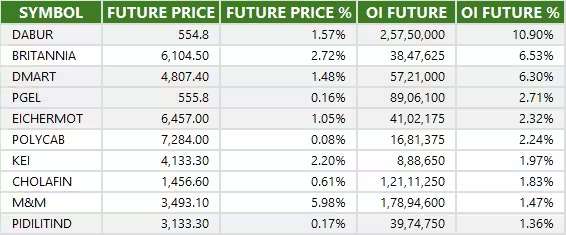
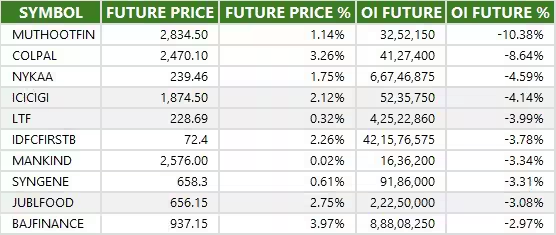
10) Long Build-up (15 Stocks)
A long build-up was seen in 15 stocks. An increase in open interest (OI) and price indicates a build-up of long positions.
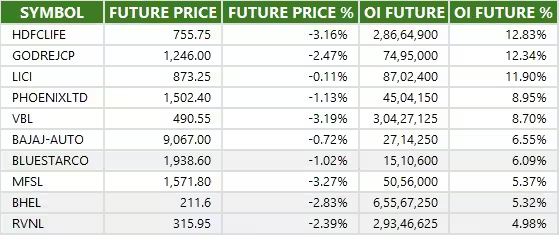
11) Long Unwinding (78 Stocks)
78 stocks saw a decline in open interest (OI) along with a fall in price, indicating long unwinding.
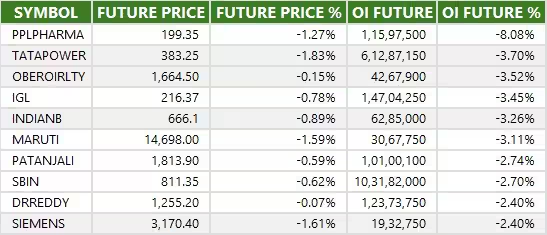
12) Short Build-up (87 Stocks)
87 stocks saw an increase in OI along with a fall in price, indicating a build-up of short positions.
13) Short-Covering (34 Stocks)
34 stocks saw short-covering, meaning a decrease in OI, along with a price increase.
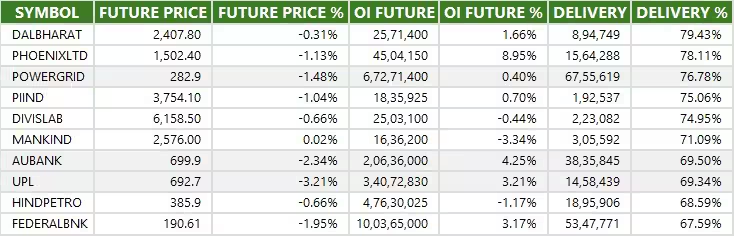
14) High Delivery Trades
Here are the stocks that saw a high share of delivery trades. A high share of delivery reflects investing (as opposed to trading) interest in a stock.
15) Stocks Under F&O Ban
Securities banned under the F&O segment include companies where derivative contracts cross 95 percent of the market-wide position limit.
Stocks added to F&O ban: Nil
Stocks retained in F&O ban: RBL Bank
Stocks removed from F&O ban: Nil


0 Comment