03 Jun , 2025 By : Debdeep Gupta

The Nifty 50 showed a smart recovery of 190 points from the day's low and closed with a moderate loss of 34 points on June 2, while defending the 24,500 as well as the 24,700 levels (similar to the midline of the Bollinger Bands) on a closing basis, which is a positive sign. The index remains within the range of 24,500–25,000. According to experts, it is expected to remain choppy in the upcoming sessions. If the index decisively breaks below the lower range, the 24,380 level is one to watch. However, in case of a rebound, 24,900 is expected to act as a hurdle for the index.
Here are 15 data points we have collated to help you spot profitable trades:
1) Key Levels For The Nifty 50 (24,717)
Resistance based on pivot points: 24,753, 24,807, and 24,894
Support based on pivot points: 24,579, 24,525, and 24,438
Special Formation: The Nifty 50 formed a small bullish candle with a long lower shadow, resembling a Bullish Hammer-type pattern (though not a classical one) on the daily charts, which is considered a bullish reversal pattern. The index managed to defend the 20-day EMA (24,640) on a closing basis. The RSI at 54.7 maintained a negative crossover, while the MACD also sustained a negative crossover with a weakening histogram—though it remains well above the zero line.
2) Key Levels For The Bank Nifty (55,903)
Resistance based on pivot points: 55,973, 56,106, and 56,322
Support based on pivot points: 55,541, 55,407, and 55,191
Resistance based on Fibonacci retracement: 56,307, 58,648
Support based on Fibonacci retracement: 54,117, 52,892
Special Formation: The Bank Nifty continued to outperform the benchmark Nifty 50, rising 154 points with above-average volumes. The index has formed a bullish candlestick pattern with a minor lower shadow on the daily charts, while also reporting a breakout of the falling resistance trendline with an expansion of the upper line of the Bollinger Bands, ahead of the RBI policy announcement later this week. The RSI at 63.09 and the Stochastic RSI both showed positive crossovers, while the MACD remained well above the zero line, despite a negative crossover.
3) Nifty Call Options Data
According to the weekly options data, the maximum Call open interest was seen at the 25,500 strike (with 92.99 lakh contracts). This level can act as a key resistance for the Nifty in the short term. It was followed by the 25,000 strike (86.55 lakh contracts), and the 25,700 strike (75.65 lakh contracts).
Maximum Call writing was observed at the 25,700 strike, which saw an addition of 27.36 lakh contracts, followed by the 25,600 and 24,700 strikes, which added 24.9 lakh and 20.31 lakh contracts, respectively. The maximum Call unwinding was seen at the 24,800 strike, which shed 7.45 lakh contracts, followed by the 24,850 and 24,900 strikes which shed 3.74 lakh and 2.12 lakh contracts, respectively.
4) Nifty Put Options Data
On the Put side, the 24,000 strike holds the maximum Put open interest (with 77.57 lakh contracts), which can act as a key support level for the Nifty. It was followed by the 24,500 strike (67.63 lakh contracts) and the 24,600 strike (53.93 lakh contracts).
The maximum Put writing was placed at the 24,500 strike, which saw an addition of 28.61 lakh contracts, followed by the 24,600 and 24,100 strikes, which added 27.23 lakh and 22.58 lakh contracts, respectively. The Put unwinding was seen at the 24,800 strike, which shed 11.04 lakh contracts, followed by the 24,400 and 25,000 strikes which shed 6.87 lakh and 4.78 lakh contracts, respectively.
5) Bank Nifty Call Options Data
According to the monthly options data, the maximum Call open interest was seen at the 56,000 strike, with 20.22 lakh contracts. This can act as a key resistance level for the index in the short term. It was followed by the 57,000 strike (8.07 lakh contracts) and the 58,000 strike (6.77 lakh contracts).
Maximum Call writing was visible at the 57,000 strike (with the addition of 1.45 lakh contracts), followed by the 58,000 strike (1.12 lakh contracts), and the 57,500 strike (1.04 lakh contracts). The maximum Call unwinding was seen at the 55,700 strike, which shed 17,190 contracts, followed by the 55,000 and 55,400 strikes, which shed 16,560 and 7,230 contracts, respectively.
6) Bank Nifty Put Options Data
On the Put side, the 56,000 strike holds the maximum Put open interest (with 16.56 lakh contracts), which can act as a key level for the index. This was followed by the 55,000 strike (10.76 lakh contracts) and the 55,500 strike (6.5 lakh contracts).
The maximum Put writing was observed at the 56,000 strike (which added 1.53 lakh contracts), followed by the 55,500 strike (1.02 lakh contracts) and the 55,000 strike (88,110 contracts). There was hardly any Put unwinding seen in the 54,200-58,100 strike band.
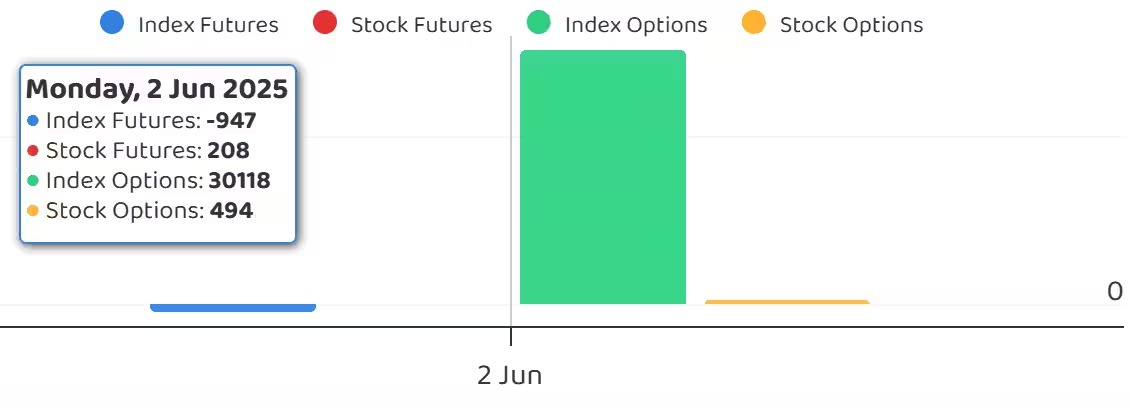
7) Funds Flow (Rs crore)
8) Put-Call Ratio
The Nifty Put-Call ratio (PCR), which indicates the mood of the market, rose to 0.82 on June 2, from 0.77 in the previous session.
The increasing PCR, or being higher than 0.7 or surpassing 1, means traders are selling more Put options than Call options, which generally indicates the firming up of a bullish sentiment in the market. If the ratio falls below 0.7 or moves towards 0.5, then it indicates selling in Calls is higher than selling in Puts, reflecting a bearish mood in the market.
9) India VIX
The India VIX, which measures expected market volatility, rebounded sharply after a three-day decline, rising 6.72 percent to 17.16 levels—signalling caution for the bulls.
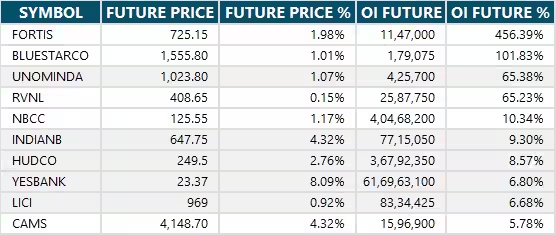
10) Long Build-up (67 Stocks)
A long build-up was seen in 67 stocks. An increase in open interest (OI) and price indicates a build-up of long positions.
11) Long Unwinding (19 Stocks)
19 stocks saw a decline in open interest (OI) along with a fall in price, indicating long unwinding.
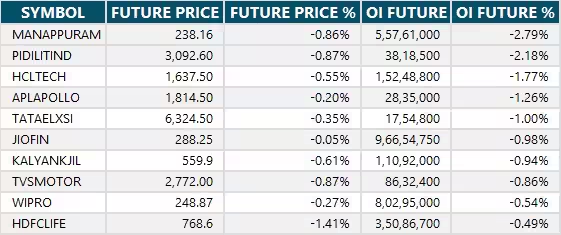
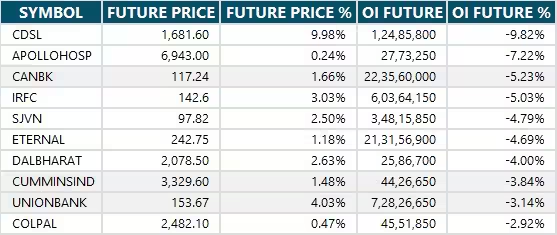
12) Short Build-up (70 Stocks)
70 stocks saw an increase in OI along with a fall in price, indicating a build-up of short positions.
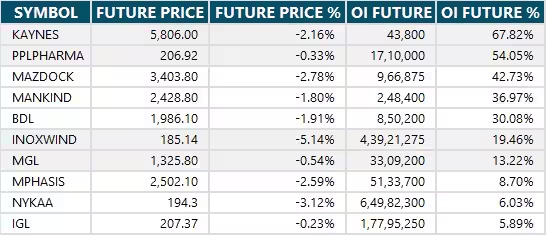
13) Short-Covering (68 Stocks)
68 stocks saw short-covering, meaning a decrease in OI, along with a price increase.
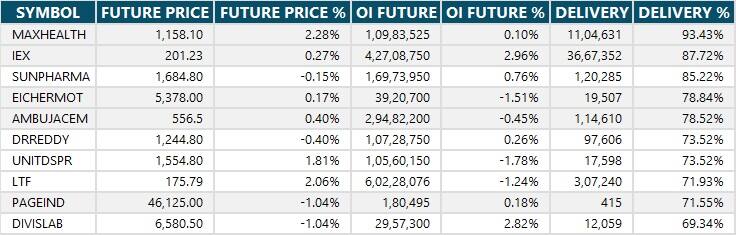
14) High Delivery Trades
Here are the stocks that saw a high share of delivery trades. A high share of delivery reflects investing (as opposed to trading) interest in a stock.
15) Stocks Under F&O Ban
Securities banned under the F&O segment include companies where derivative contracts cross 95 percent of the market-wide position limit.
Stocks added to F&O ban: Nil
Stocks retained in F&O ban: Manappuram Finance
Stocks removed from F&O ban: Nil


0 Comment