18 Aug , 2025 By : Debdeep Gupta

The Nifty 50 experienced rangebound trading on August 14, though it extended its upmove for another session. The index remained within Tuesday's range and sustained above the 100-day EMA for the last two days. According to experts, as long as it trades below the 50-day EMA (24,813), consolidation is expected to continue, with immediate support at 24,465, followed by a key support level at 24,350. On the flip side, the index is expected to face a hurdle at 24,700. If it sustains above this level, 24,800 will be the next level to watch, followed by the 25,000 zone.
Here are 15 data points we have collated to help you spot profitable trades:
1) Key Levels For The Nifty 50 (24,631)
Resistance based on pivot points: 24,663, 24,681, and 24,711
Support based on pivot points: 24,605, 24,587, and 24,557
Special Formation: The Nifty 50 formed a small bullish candle with an upper shadow on the daily charts, indicating rangebound action. The index still traded below the midline of the Bollinger Bands (24,760). Sustaining above this level could change the prevailing trend. The RSI stood at 44.54, maintaining a positive crossover but still in the lower band, while the MACD remained below the zero line, although the weakness in the histogram continued to fade. All this indicates that the index is in a consolidative phase with limited momentum. On the weekly timeframe, the index formed a bullish candle after six consecutive red candles, signaling a Tweezer Bottom-like pattern (a bullish reversal pattern), which requires follow-up buying for confirmation.
2) Key Levels For The Bank Nifty (55,342)
Resistance based on pivot points: 55,449, 55,543, and 55,695
Support based on pivot points: 55,144, 55,050, and 54,898
Resistance based on Fibonacci retracement: 55,548, 55,946
Support based on Fibonacci retracement: 54,392, 53,392
Special Formation: The Bank Nifty formed a bullish candle with a small upper shadow on the daily charts but remained within last Friday's range for the fourth consecutive session. It continued to hold above the 100-day EMA, signaling healthy support, but remained well below the 50-day EMA and the midline of the Bollinger Bands, indicating ongoing consolidation. The MACD and its histogram remained below the zero line, while the RSI, at 41.91, showed a positive crossover but continued to stay in the lower band. This indicates a consolidative trend with limited momentum unless follow-through buying emerges.
3) Nifty Call Options Data
According to the weekly options data, the 25,000 strike holds the maximum Call open interest (with 48.85 lakh contracts). This level can act as a key resistance for the Nifty in the short term. It was followed by the 24,700 strike (35.39 lakh contracts), and the 24,800 strike (30.3 lakh contracts).
Maximum Call writing was observed at the 25,000 strike, which saw an addition of 23.43 lakh contracts, followed by the 24,700 and 24,800 strikes, which added 15.41 lakh and 14.12 lakh contracts, respectively. The maximum Call unwinding was seen at the 24,450 strike, which shed 31,425 contracts, followed by the 24,550 and 24,350 strikes, which shed 29,325 and 6,300 contracts, respectively.
4) Nifty Put Options Data
On the Put side, the maximum Put open interest was seen at the 24,000 strike (with 37.22 lakh contracts), which can act as a key support level for the Nifty. It was followed by the 24,600 strike (34.06 lakh contracts) and the 24,500 strike (26.43 lakh contracts).
The maximum Put writing was placed at the 24,000 strike, which saw an addition of 14.58 lakh contracts, followed by the 24,600 and 24,500 strikes, which added 10.91 lakh and 8.72 lakh contracts, respectively. There was hardly Put unwinding seen in the 23,950-25,400 strike band.
5) Bank Nifty Call Options Data
According to the monthly options data, the maximum Call open interest was placed at the 57,000 strike, with 22.75 lakh contracts. This can act as a key resistance level for the index in the short term. It was followed by the 56,000 strike (14.95 lakh contracts) and the 55,500 strike (11.56 lakh contracts).
Maximum Call writing was observed at the 57,500 strike (with the addition of 1.06 lakh contracts), followed by the 56,200 strike (20,265 contracts), and the 55,400 strike (10,325 contracts). The maximum Call unwinding was seen at the 57,000 strike, which shed 1.76 lakh contracts, followed by the 55,200 and 55,500 strikes, which shed 99,820 contracts, and 76,335 contracts, respectively.
6) Bank Nifty Put Options Data
On the Put side, the 57,000 strike holds the maximum Put open interest (with 13.13 lakh contracts), which can act as a key level for the index. This was followed by the 55,000 strike (9.58 lakh contracts) and the 55,500 strike (9.03 lakh contracts).
The maximum Put writing was observed at the 55,300 strike (which added 44,975 contracts), followed by the 55,500 strike (37,135 contracts) and the 55,400 strike (36,155 contracts). The maximum Put unwinding was seen at the 54,000 strike, which shed 93,450 contracts, followed by the 55,000 and 53,900 strikes, which shed 69,650 and 18,865 contracts, respectively.
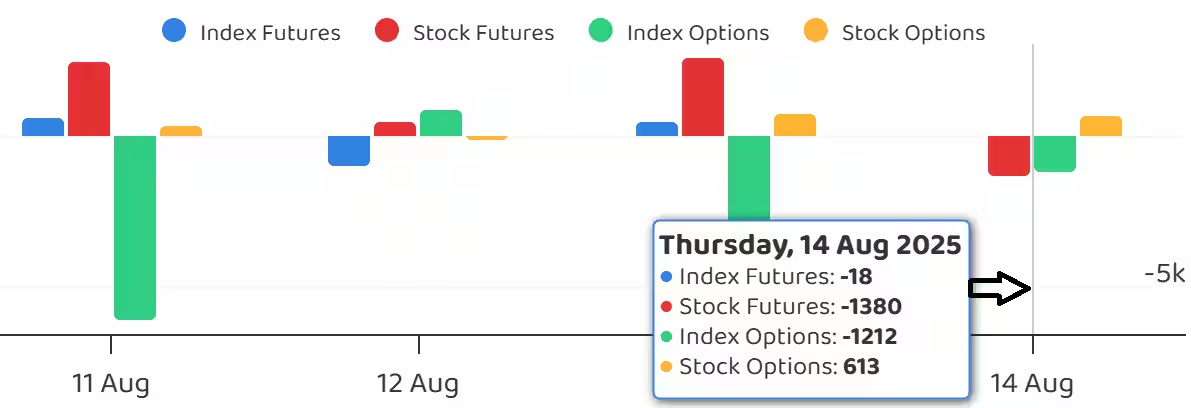
7) Funds Flow (Rs crore)
8) Put-Call Ratio
The Nifty Put-Call ratio (PCR), which indicates the mood of the market, fell to 1.01 on August 14, compared to 1.08 in the previous session.
The increasing PCR, or being higher than 0.7 or surpassing 1, means traders are selling more Put options than Call options, which generally indicates the firming up of a bullish sentiment in the market. If the ratio falls below 0.7 or moves towards 0.5, then it indicates selling in Calls is higher than selling in Puts, reflecting a bearish mood in the market.
9) India VIX
India VIX, which measures expected market volatility, remained above short-term moving averages and sustained above the 12 mark for the fifth consecutive session, rising 1.77 percent to 12.36. This signals a note of caution for bulls, indicating heightened volatility expectations in the near term.
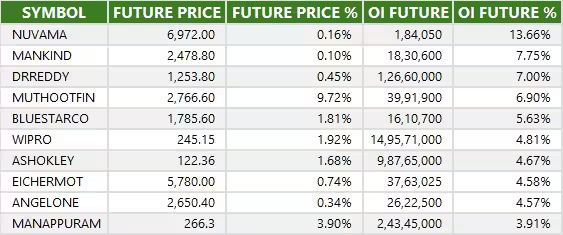
10) Long Build-up (32 Stocks)
A long build-up was seen in 32 stocks. An increase in open interest (OI) and price indicates a build-up of long positions.11) Long Unwinding (57 Stocks)
57 stocks saw a decline in open interest (OI) along with a fall in price, indicating long unwinding.
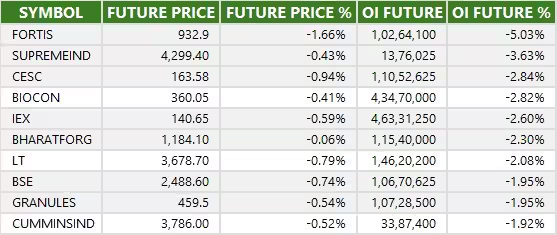
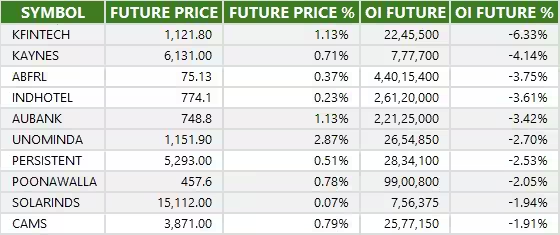
11) Long Unwinding (57 Stocks)
57 stocks saw a decline in open interest (OI) along with a fall in price, indicating long unwinding.
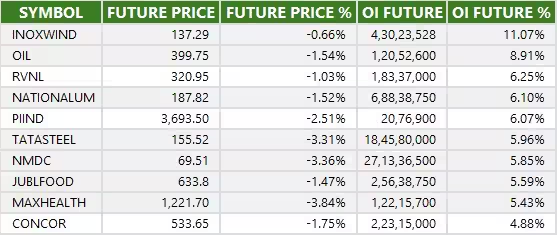
12) Short Build-up (85 Stocks)
85 stocks saw an increase in OI along with a fall in price, indicating a build-up of short positions.
13) Short-Covering (44 Stocks)
44 stocks saw short-covering, meaning a decrease in OI, along with a price increase.
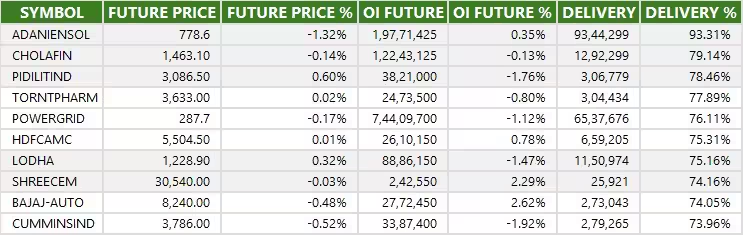
14) High Delivery Trades
Here are the stocks that saw a high share of delivery trades. A high share of delivery reflects investing (as opposed to trading) interest in a stock.
15) Stocks Under F&O Ban
Securities banned under the F&O segment include companies where derivative contracts cross 95 percent of the market-wide position limit.
Stocks added to F&O ban: Nil
Stocks retained in F&O ban: PG Electroplast, PNB Housing Finance, RBL Bank, Titagarh Rail Systems
Stocks removed from F&O ban: Nil


0 Comment