20 Aug , 2025 By : Debdeep Gupta

The Nifty 50 extended its upward journey for the fourth consecutive session, rising 0.4 percent on August 19, though it traded within the previous day's range. The index remained above key moving averages, and the momentum indicators showed a bullish crossover. According to experts, after the recent rally, the index might consolidate; however, the overall trend remains positive. It needs to surpass and sustain above the 25,000 zone, which is a crucial level for a further sharp rally toward 25,250. On the downside, 24,850 (Monday's low) is expected to act as a support zone in the near term.
Here are 15 data points we have collated to help you spot profitable trades:
1) Key Levels For The Nifty 50 (24,981)
Resistance based on pivot points: 25,009, 25,042, and 25,095
Support based on pivot points: 24,903, 24,870, and 24,817
Special Formation: The Nifty 50 formed a bullish candle with an upper shadow beside the previous day's red candle on the daily timeframe, indicating rangebound action. The index stayed above all key moving averages, with the 10-day and 20-day EMAs inclining upward. The 50-day EMA is on the verge of turning upward, which is considered positive. The RSI climbed to 55.12 with a bullish crossover, and the histogram gained more strength, with the MACD maintaining a positive crossover, though still below the zero line. This indicates bullish undertone amid consolidation.
2) Key Levels For The Bank Nifty (55,865)
Resistance based on pivot points: 55,950, 56,034, and 56,170
Support based on pivot points: 55,676, 55,592, and 55,455
Resistance based on Fibonacci retracement: 56,278, 56,600
Support based on Fibonacci retracement: 55,627, 54,396
Special Formation: The Bank Nifty finally closed above the 20-day and 50-day EMAs as well as the midline of the Bollinger Bands in a single session, with the 10-day EMA inclining upward. The index formed a bullish candle on the daily charts, indicating a positive trend. The MACD gave a bullish crossover with the histogram gaining strength, and the RSI jumped to 49.55 with a positive crossover. This indicates renewed bullish momentum in the banking space.
3) Nifty Call Options Data
According to the weekly options data, the 25,000 strike holds the maximum Call open interest (with 1.18 crore contracts). This level can act as a key resistance for the Nifty in the short term. It was followed by the 25,500 strike (1.15 crore contracts), and the 25,200 strike (88.45 lakh contracts).
Maximum Call writing was observed at the 25,500 strike, which saw an addition of 33.4 lakh contracts, followed by the 25,300 and 25,400 strikes, which added 29.38 lakh and 15.77 lakh contracts, respectively. The maximum Call unwinding was seen at the 24,900 strike, which shed 14.48 lakh contracts, followed by the 25,600 and 24,950 strikes, which shed 14.33 lakh and 10.2 lakh contracts, respectively.
4) Nifty Put Options Data
On the Put side, the maximum Put open interest was seen at the 24,900 strike (with 1.13 crore contracts), which can act as a key support level for the Nifty. It was followed by the 25,000 strike (1.04 crore contracts) and the 24,800 strike (84.97 lakh contracts).
The maximum Put writing was placed at the 25,000 strike, which saw an addition of 60.04 lakh contracts, followed by the 24,900 and 24,950 strikes, which added 58.37 lakh and 40.99 lakh contracts, respectively. The maximum Put unwinding was seen at the 24,400 strike, which shed 5.97 lakh contracts, followed by the 25,800 and 25,700 strikes, which shed 5,775 and 3,900 contracts, respectively.
5) Bank Nifty Call Options Data
According to the monthly options data, the maximum Call open interest was seen at the 57,000 strike, with 23.23 lakh contracts. This can act as a key resistance level for the index in the short term. It was followed by the 56,000 strike (16.13 lakh contracts) and the 58,000 strike (11.97 lakh contracts).
Maximum Call writing was observed at the 56,500 strike (with the addition of 43,925 contracts), followed by the 56,900 strike (43,190 contracts), and the 56,400 strike (38,570 contracts). The maximum Call unwinding was seen at the 55,500 strike, which shed 91,315 contracts, followed by the 57,800 and 57,000 strikes, which shed 41,790 contracts, and 37,275 contracts, respectively.
6) Bank Nifty Put Options Data
On the Put side, the 57,000 strike holds the maximum Put open interest (with 12.92 lakh contracts), which can act as a key level for the index. This was followed by the 56,000 strike (11.51 lakh contracts) and the 55,500 strike (10.39 lakh contracts).
The maximum Put writing was observed at the 55,700 strike (which added 2.76 lakh contracts), followed by the 55,600 strike (1.25 lakh contracts) and the 55,900 strike (1.19 lakh contracts). The maximum Put unwinding was seen at the 56,600 strike, which shed 24,290 contracts, followed by the 54,300 and 54,900 strikes, which shed 17,430 and 14,455 contracts, respectively.
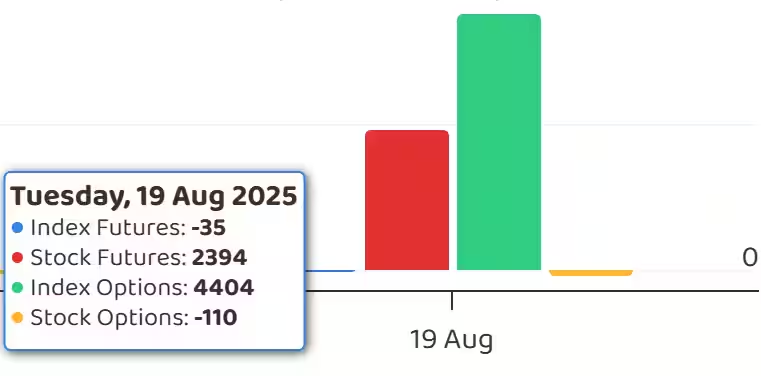
7) Funds Flow (Rs crore)
8) Put-Call Ratio
The Nifty Put-Call ratio (PCR), which indicates the mood of the market, climbed to 1.14 on August 19, compared to 1.00 in the previous session.
The increasing PCR, or being higher than 0.7 or surpassing 1, means traders are selling more Put options than Call options, which generally indicates the firming up of a bullish sentiment in the market. If the ratio falls below 0.7 or moves towards 0.5, then it indicates selling in Calls is higher than selling in Puts, reflecting a bearish mood in the market.
9) India VIX
The India VIX, which measures expected market volatility, fell below short-term moving averages and corrected 4.46 percent to 11.79, offering comfort to bulls and signaling reduced uncertainty in the market.
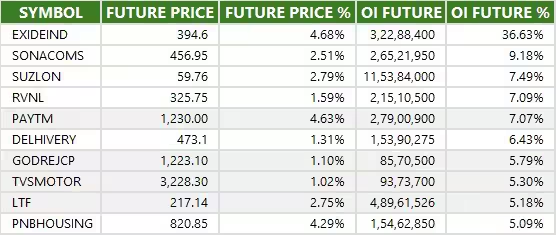
10) Long Build-up (102 Stocks)
A long build-up was seen in 102 stocks. An increase in open interest (OI) and price indicates a build-up of long positions.
11) Long Unwinding (13 Stocks)
13 stocks saw a decline in open interest (OI) along with a fall in price, indicating long unwinding.
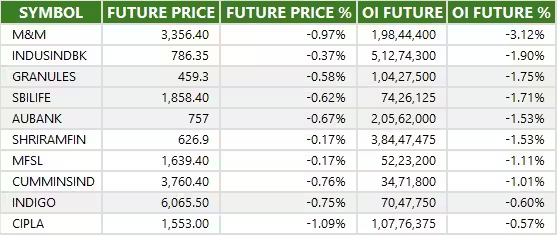
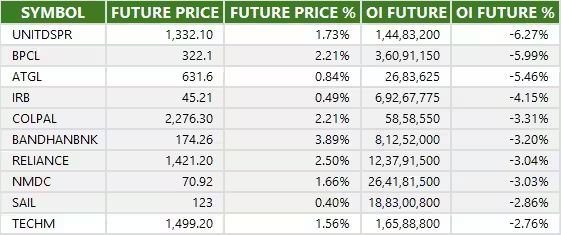
12) Short Build-up (36 Stocks)
36 stocks saw an increase in OI along with a fall in price, indicating a build-up of short positions.
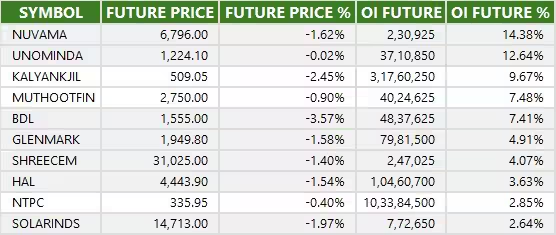
13) Short-Covering (70 Stocks)
70 stocks saw short-covering, meaning a decrease in OI, along with a price increase.
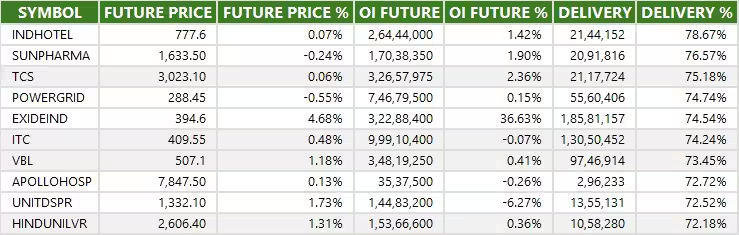
14) High Delivery Trades
Here are the stocks that saw a high share of delivery trades. A high share of delivery reflects investing (as opposed to trading) interest in a stock.
15) Stocks Under F&O Ban
Securities banned under the F&O segment include companies where derivative contracts cross 95 percent of the market-wide position limit.
Stocks added to F&O ban: Nil
Stocks retained in F&O ban: RBL Bank, Titagarh Rail Systems
Stocks removed from F&O ban: PG Electroplast


0 Comment