19 Aug , 2025 By : Debdeep Gupta

The Nifty 50 staged a strong performance on August 18, rising 1 percent following buzz around GST reforms. The index witnessed a robust gap-up opening and is now trading above all key moving averages, with a bullish crossover in momentum indicators. As long as the index defends the bullish gap between 24,670–24,850, an upward move toward 25,000, followed by 25,250 (a crucial level for negating the lower highs–lower lows structure), cannot be ruled out. On the flip side, the 24,700–24,600 zone is expected to act as a strong support area, while the August low of 24,337 is likely to serve as a near-term bottom, according to experts.
Here are 15 data points we have collated to help you spot profitable trades:
1) Key Levels For The Nifty 50 (24,877)
Resistance based on pivot points: 24,982, 25,022, and 25,086
Support based on pivot points: 24,853, 24,813, and 24,748
Special Formation: The Nifty 50 formed a bearish candle with a long upper shadow on the daily charts after the strong gap-up opening, indicating a potential reversal pattern. Despite this, the index climbed above the 20-day and 50-day EMAs, as well as the midline of the Bollinger Bands. The MACD showed a positive crossover below the zero line, with the histogram turning positive. The RSI jumped to 52.28, accompanied by a healthy bullish crossover. These developments indicate building bullish momentum, despite the bearish candle formation.
2) Key Levels For The Bank Nifty (55,735)
Resistance based on pivot points: 56,041, 56,161, and 56,355
Support based on pivot points: 55,652, 55,532, and 55,338
Resistance based on Fibonacci retracement: 56,268, 56,588
Support based on Fibonacci retracement: 55,622, 54,392
Special Formation: The Bank Nifty displayed a similar pattern after a gap-up opening but failed to sustain above the 20-day and 50-day EMAs and the midline of the Bollinger Bands on a closing basis. The index, however, has seen a strong consolidation breakout. The RSI rose to 47.74, showing a bullish crossover. The MACD edged higher but remains below the zero line with a bearish crossover, although the weakness in the histogram has consistently been fading. These signals suggest that while momentum remains tentative, underlying weakness is gradually easing.
3) Nifty Call Options Data
According to the weekly options data, the maximum Call open interest was seen at the 25,000 strike (with 1.06 crore contracts). This level can act as a key resistance for the Nifty in the short term. It was followed by the 25,500 strike (82.01 lakh contracts), and the 25,200 strike (77.7 lakh contracts).
Maximum Call writing was observed at the 25,000 strike, which saw an addition of 57.9 lakh contracts, followed by the 25,200 and 25,100 strikes, which added 54.31 lakh and 50.5 lakh contracts, respectively. The maximum Call unwinding was seen at the 24,700 strike, which shed 19.81 lakh contracts, followed by the 24,600 and 24,800 strikes, which shed 15.05 lakh and 14.44 lakh contracts, respectively.
4) Nifty Put Options Data
On the Put side, the 24,800 strike holds the maximum Put open interest (with 67.45 lakh contracts), which can act as a key support level for the Nifty. It was followed by the 24,500 strike (55.86 lakh contracts) and the 24,400 strike (55.76 lakh contracts).
The maximum Put writing was placed at the 24,800 strike, which saw an addition of 59.87 lakh contracts, followed by the 24,900 and 25,000 strikes, which added 50.21 lakh and 36.32 lakh contracts, respectively. There was hardly Put unwinding seen in the 24,200-25,750 strike band.
5) Bank Nifty Call Options Data
According to the monthly options data, the 57,000 strike holds the maximum Call open interest, with 23.61 lakh contracts. This can act as a key resistance level for the index in the short term. It was followed by the 56,000 strike (15.75 lakh contracts) and the 56,500 strike (9.11 lakh contracts).
Maximum Call writing was observed at the 56,100 strike (with the addition of 1.41 lakh contracts), followed by the 57,500 strike (1.21 lakh contracts), and the 55,900 strike (1.03 lakh contracts). The maximum Call unwinding was seen at the 55,500 strike, which shed 3.53 lakh contracts, followed by the 55,000 and 55,400 strikes, which shed 2.09 lakh contracts, and 1.86 lakh contracts, respectively.
6) Bank Nifty Put Options Data
On the Put side, the maximum Put open interest was seen at the 57,000 strike (with 12.95 lakh contracts), which can act as a key level for the index. This was followed by the 56,000 strike (10.4 lakh contracts) and the 55,000 strike (9.88 lakh contracts).
The maximum Put writing was observed at the 56,000 strike (which added 2.04 lakh contracts), followed by the 55,800 strike (1.93 lakh contracts) and the 54,900 strike (1.45 lakh contracts). The maximum Put unwinding was seen at the 54,000 strike, which shed 63,350 contracts, followed by the 55,300 and 55,100 strikes, which shed 27,825 and 23,065 contracts, respectively.
7) Funds Flow (Rs crore)

8) Put-Call Ratio
The Nifty Put-Call ratio (PCR), which indicates the mood of the market, dropped to 1.00 on August 18, compared to 1.01 in the previous session.
The increasing PCR, or being higher than 0.7 or surpassing 1, means traders are selling more Put options than Call options, which generally indicates the firming up of a bullish sentiment in the market. If the ratio falls below 0.7 or moves towards 0.5, then it indicates selling in Calls is higher than selling in Puts, reflecting a bearish mood in the market.
9) India VIX
The India VIX, the fear index, declined by 0.12 percent to 12.34, after experiencing a broad intraday range of 11.75–13.47. This indicates that market participants are less fearful, suggesting a stable and resilient market environment.
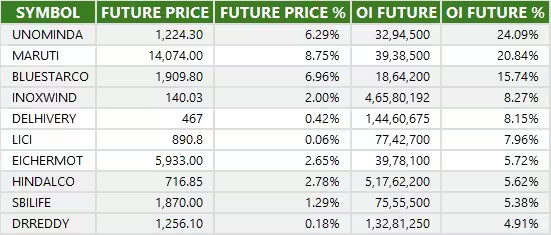
10) Long Build-up (93 Stocks)
A long build-up was seen in 93 stocks. An increase in open interest (OI) and price indicates a build-up of long positions.
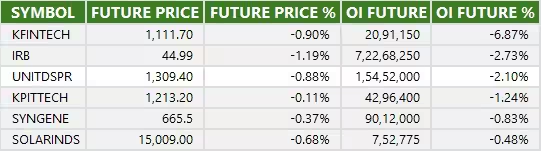
11) Long Unwinding (6 Stocks)
6 stocks saw a decline in open interest (OI) along with a fall in price, indicating long unwinding.
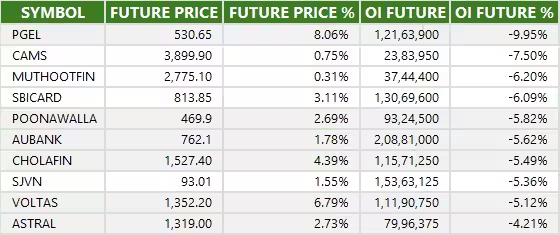
12) Short Build-up (42 Stocks)
42 stocks saw an increase in OI along with a fall in price, indicating a build-up of short positions.
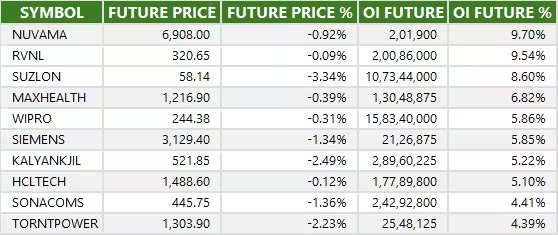
13) Short-Covering (80 Stocks)
80 stocks saw short-covering, meaning a decrease in OI, along with a price increase.
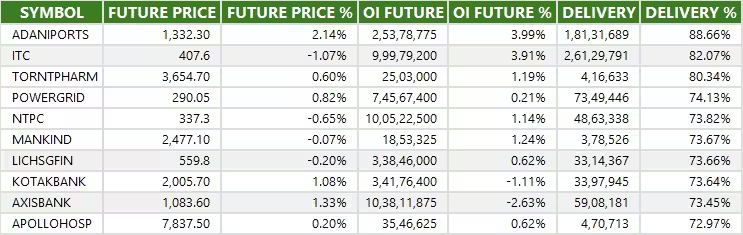
14) High Delivery Trades
Here are the stocks that saw a high share of delivery trades. A high share of delivery reflects investing (as opposed to trading) interest in a stock.
15) Stocks Under F&O Ban
Securities banned under the F&O segment include companies where derivative contracts cross 95 percent of the market-wide position limit.
Stocks added to F&O ban: Nil
Stocks retained in F&O ban: PG Electroplast, RBL Bank, Titagarh Rail Systems
Stocks removed from F&O ban: PNB Housing Finance


0 Comment