01 Oct , 2025 By : Debdeep Gupta

The market experienced a southward journey for the eighth consecutive session, although the selling pressure has eased in the past two days. On September 30, the monthly F&O expiry day, the Nifty 50 fell by 0.1 percent. Technical and momentum indicators continue to signal a negative trend. If the Nifty 50 breaks 24,500—coinciding with the upward-sloping support trendline—the fall may extend toward the August lows in the 24,400–24,300 zone. However, on the upside, the index may face resistance at the 24,700–24,900 levels, according to experts.
Here are 15 data points we have collated to help you spot profitable trades:
1) Key Levels For The Nifty 50 (24,611)
Resistance based on pivot points: 24,699, 24,733, and 24,788
Support based on pivot points: 24,588, 24,554, and 24,499
Special Formation: The Nifty 50 formed a bearish candle with minor upper and lower shadows on the daily timeframe, indicating choppy trade. The index has continued the lower top-lower bottom structure for the eighth straight day, with short- and medium-term moving averages trending downward. The 10-day EMA has fallen below both the 20- and 50-day EMAs. The RSI dropped to 38.13, while the MACD declined below the zero line with a negative crossover. The histogram showed further weakness, indicating that the trend remains bearish.
2) Key Levels For The Bank Nifty (54,636)
Resistance based on pivot points: 54,755, 54,823, and 54,934
Support based on pivot points: 54,533, 54,465, and 54,354
Resistance based on Fibonacci retracement: 54,841, 55,031
Support based on Fibonacci retracement: 54,430, 54,048
Special Formation: The Bank Nifty gained strength for the second straight session, rising by 175 points on the monthly F&O expiry day. The index formed a bearish candle with upper and lower shadows, resembling a high-wave-like candlestick pattern on the daily charts. This suggests volatility and indecision between bulls and bears for another session. The index is well below the 20-, 50-, and 100-day EMAs, with the 10-day EMA trading below all three. Additionally, the 20-day EMA is on the verge of falling below the 100-day EMA. The RSI at 45.14 showed an uptick but still maintains a bearish crossover, while the MACD continues its bearish crossover, with further weakness in the histogram.
3) Nifty Call Options Data
According to the weekly options data, the maximum Call open interest was seen at the 25,000 strike (with 69.08 lakh contracts). This level can act as a key resistance for the Nifty in the short term. It was followed by the 24,700 strike (49.19 lakh contracts), and the 24,900 strike (45.28 lakh contracts).
Maximum Call writing was observed at the 24,700 strike, which saw an addition of 34.18 lakh contracts, followed by the 25,000 and 24,600 strikes, which added 31.62 lakh and 23.28 lakh contracts, respectively. There was hardly any Call unwinding seen in the 23,800-25,500 strike band.
4) Nifty Put Options Data
On the Put side, the 24,600 strike holds the maximum Put open interest (with 41.01 lakh contracts), which can act as a key support level for the Nifty. It was followed by the 24,000 strike (40.68 lakh contracts) and the 24,500 strike (35.54 lakh contracts).
The maximum Put writing was placed at the 24,600 strike, which saw an addition of 24.71 lakh contracts, followed by the 24,300 and 24,000 strikes, which added 24.28 lakh and 19 lakh contracts, respectively. There was hardly any Put unwinding seen in the 23,800-25,500 strike band.
5) Bank Nifty Call Options Data
According to the monthly options data, the 56,000 strike holds the maximum Call open interest, with 9.9 lakh contracts. This can act as a key resistance level for the index in the short term. It was followed by the 55,000 strike (9.39 lakh contracts) and the 55,500 strike (4.43 lakh contracts).
Maximum Call writing was observed at the 55,000 strike (with the addition of 2.09 lakh contracts), followed by the 56,000 strike (1.96 lakh contracts), and the 54,000 strike (95,655 contracts). There was hardly any Call unwinding seen in the 52,600-56,750 strike band.
6) Bank Nifty Put Options Data
On the Put side, the maximum Put open interest was placed at the 54,000 strike (with 8.69 lakh contracts), which can act as a key support level for the index. This was followed by the 55,000 strike (8.01 lakh contracts) and the 53,000 strike (6.56 lakh contracts).
The maximum Put writing was observed at the 55,000 strike (which added 2.05 lakh contracts), followed by the 54,000 strike (1.98 lakh contracts) and the 54,500 strike (82,670 contracts). There was hardly any Put winding seen in the 52,700-56,750 strike band.
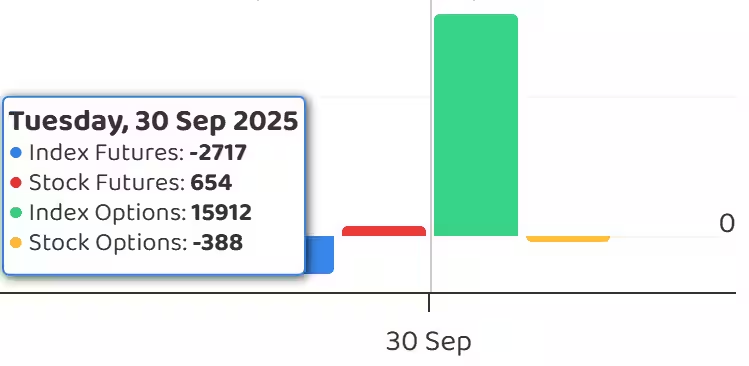
7) Funds Flow (Rs crore)
8) Put-Call Ratio
The Nifty Put-Call ratio (PCR), which indicates the mood of the market, advanced to 0.91 on September 30, compared to 0.71 in the previous session.
The increasing PCR, or being higher than 0.7 or surpassing 1, means traders are selling more Put options than Call options, which generally indicates the firming up of a bullish sentiment in the market. If the ratio falls below 0.7 or moves towards 0.5, then it indicates selling in Calls is higher than selling in Puts, reflecting a bearish mood in the market.
9) India VIX
The India VIX, which measures expected market volatility, attempted to sustain above its medium-term moving average but failed for the third consecutive day, declining by 2.64 percent to 11.07. The index remains above short-term moving averages, signaling that volatility is still present but may be easing in the short term.
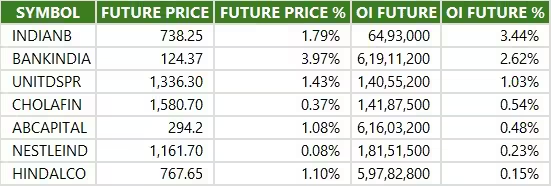
10) Long Build-up (7 Stocks)
A long build-up was seen in 7 stocks. An increase in open interest (OI) and price indicates a build-up of long positions.
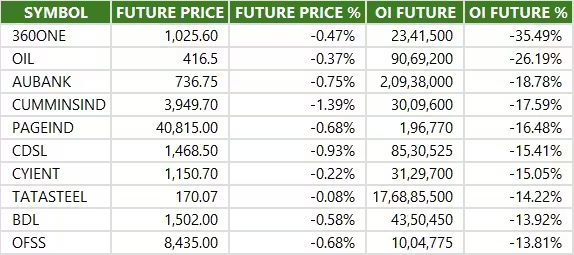
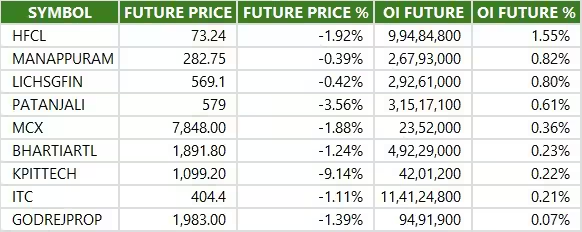
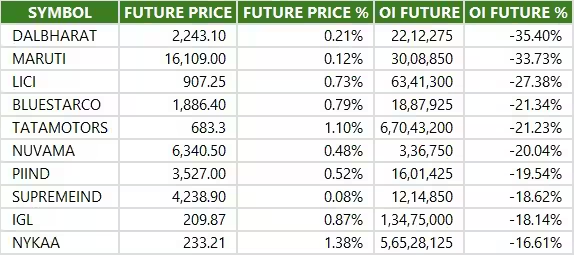
11) Long Unwinding (89 Stocks)
89 stocks saw a decline in open interest (OI) along with a fall in price, indicating long unwinding.
12) Short Build-up (9 Stocks)
9 stocks saw an increase in OI along with a fall in price, indicating a build-up of short positions.
13) Short-Covering (107 Stocks)
107 stocks saw short-covering, meaning a decrease in OI, along with a price increase.
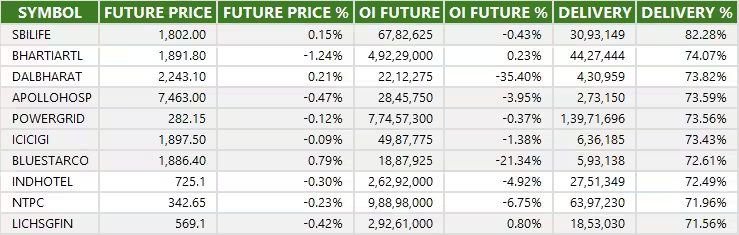
14) High Delivery Trades and High Rollovers
Here are the stocks that saw a high share of delivery trades. A high share of delivery reflects investing (as opposed to trading) interest in a stock.
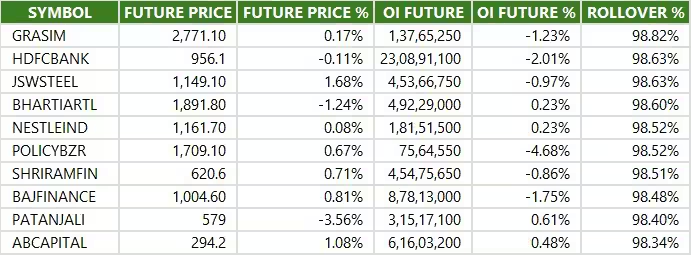
Here are the stocks which saw the highest rollovers on expiry day.
15) Stocks Under F&O Ban
Securities banned under the F&O segment include companies where derivative contracts cross 95 percent of the market-wide position limit.
Stocks added to F&O ban: Nil
Stocks retained in F&O ban: Sammaan Capital
Stocks removed from F&O ban: RBL Bank


0 Comment