22 May , 2025 By : Debdeep Gupta

The Nifty 50 rebounded after three days of losses, climbing half a percent on May 21, but traded within the previous day's range. The index defended both the prior day's low (24,670) and the 10-day EMA (24,711), while the elevated VIX still signals caution for bulls. Hence, if the index decisively breaks below these levels, selling pressure may drag it down toward the crucial support zone at 24,500. However, if the index extends its northward journey amid likely rangebound trading, it may face resistance at the 25,000 mark, experts said..
Here are 15 data points we have collated to help you spot profitable trades:
1) Key Levels For The Nifty 50 (24,813)
Resistance based on pivot points: 24,915, 24,976, and 25,076
Support based on pivot points: 24,715, 24,654, and 24,554
Special Formation: The Nifty 50 formed a small bullish candle with an upper shadow on the daily charts after three consecutive red candles, indicating an attempt at an upside bounce—but with selling pressure at higher levels. The upper line of the Bollinger Bands expanded further, signaling resistance for the index around the 25,119 mark. The MACD (Moving Average Convergence Divergence) showed a negative crossover with a weakening histogram, but it remained well above the zero line. Meanwhile, the RSI edged higher to 59.87, approaching the 60 zone.
2) Key Levels For The Bank Nifty (55,075)
Resistance based on pivot points: 55,281, 55,434, and 55,680
Support based on pivot points: 54,787, 54,635, and 54,388
Resistance based on Fibonacci retracement: 56,342, 58,700
Support based on Fibonacci retracement: 54,137, 52,913
Special Formation: The Bank Nifty formed a Doji-like candlestick pattern on the daily timeframe, signaling indecision among bulls and bears, while volumes remained low. The index managed to defend not only the 10-day EMA but also the midline of the Bollinger Bands and the previous day's low—developments that are considered positive. The MACD remained below the reference line with a moderately weakening histogram, but it was still well above the zero line, indicating the absence of a major bearish trend. The RSI also stayed above the 50 mark at 57.70 and was tilted upward..
3) Nifty Call Options Data
According to the weekly options data, the maximum Call open interest was seen at the 25,500 strike (with 1.35 crore contracts). This level can act as a key resistance for the Nifty in the short term. It was followed by the 25,000 strike (1.17 crore contracts), and the 25,300 strike (89.41 lakh contracts).
Maximum Call writing was observed at the 25,300 strike, which saw an addition of 13.47 lakh contracts, followed by the 25,600 and 25,400 strikes, which added 11.81 lakh and 10.02 lakh contracts, respectively. The maximum Call unwinding was seen at the 25,000 strike, which shed 52.66 lakh contracts, followed by the 25,100 and 24,900 strikes, which shed 19.55 lakh and 13.64 lakh contracts, respectively.
4) Nifty Put Options Data
On the Put side, the 24,000 strike holds the maximum Put open interest (with 1.11 crore contracts), which can act as a key support level for the Nifty. It was followed by the 24,800 strike (67.55 lakh contracts) and the 24,400 strike (63.66 lakh contracts).
The maximum Put writing was placed at the 24,000 strike, which saw an addition of 36.28 lakh contracts, followed by the 24,400 and 24,800 strikes, which added 35.31 lakh and 33.56 lakh contracts, respectively. The Put unwinding was seen at the 24,500 strike, which shed 8.08 lakh contracts, followed by the 25,000 and 24,950 strikes which shed 7.91 lakh and 3.1 lakh contracts, respectively.
5) Bank Nifty Call Options Data
According to the monthly options data, the maximum Call open interest was seen at the 56,000 strike, with 14.09 lakh contracts. This can act as a key resistance level for the index in the short term. It was followed by the 55,500 strike (13.46 lakh contracts) and the 57,000 strike (11.74 lakh contracts).
Maximum Call writing was visible at the 57,000 strike (with the addition of 58,620 contracts), followed by the 56,600 strike (31,320 contracts), and the 56,800 strike (16,320 contracts). The maximum Call unwinding was seen at the 55,500 strike, which shed 1.83 lakh contracts, followed by the 55,000 and 56,000 strikes, which shed 91,710 and 59,940 contracts, respectively.
6) Bank Nifty Put Options Data
On the Put side, the 55,000 strike holds the maximum Put open interest (with 18.12 lakh contracts), which can act as a key support level for the index. This was followed by the 54,000 strike (11.91 lakh contracts) and the 55,500 strike (7.31 lakh contracts).
The maximum Put writing was observed at the 54,800 strike (which added 51,000 contracts), followed by the 53,200 strike (34,560 contracts) and the 54,000 strike (26,760 contracts). The maximum Put unwinding was seen at the 55,000 strike, which shed 1.21 lakh contracts, followed by the 54,500 and 53,700 strikes, which shed 29,850 and 23,700 contracts, respectively.
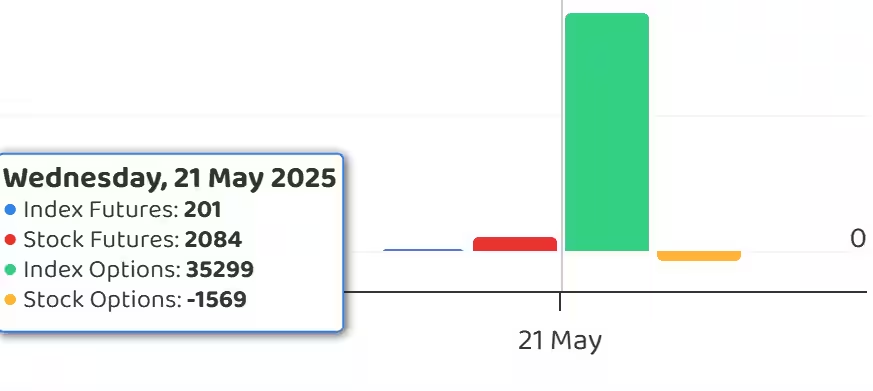
7) Funds Flow (Rs crore)
8) Put-Call Ratio
The Nifty Put-Call ratio (PCR), which indicates the mood of the market, rose to 0.81 on May 21, from 0.69 in the previous session.
The increasing PCR, or being higher than 0.7 or surpassing 1, means traders are selling more Put options than Call options, which generally indicates the firming up of a bullish sentiment in the market. If the ratio falls below 0.7 or moves towards 0.5, then it indicates selling in Calls is higher than selling in Puts, reflecting a bearish mood in the market.
9) India VIX
The India VIX, known as the fear gauge, remained firmly above the 17 mark, closing at 17.55—up 0.93 percent. This marked the third consecutive session of gains, indicating that bulls should remain cautious.
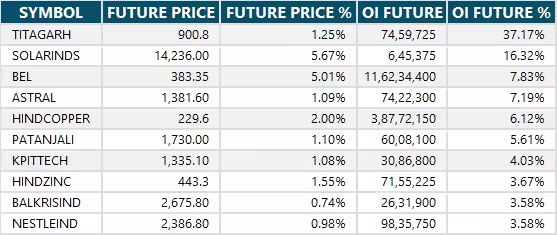
10) Long Build-up (89 Stocks)
A long build-up was seen in 89 stocks. An increase in open interest (OI) and price indicates a build-up of long positions.
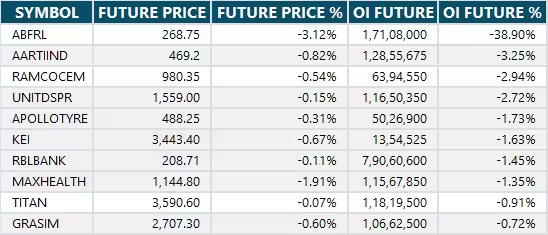
11) Long Unwinding (13 Stocks)
13 stocks saw a decline in open interest (OI) along with a fall in price, indicating long unwinding.
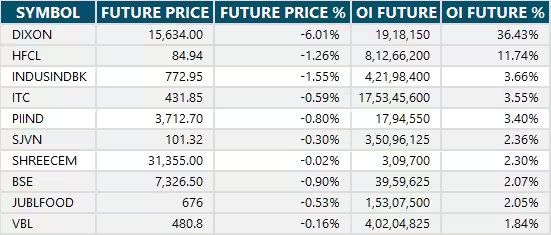
12) Short Build-up (32 Stocks)
32 stocks saw an increase in OI along with a fall in price, indicating a build-up of short positions.
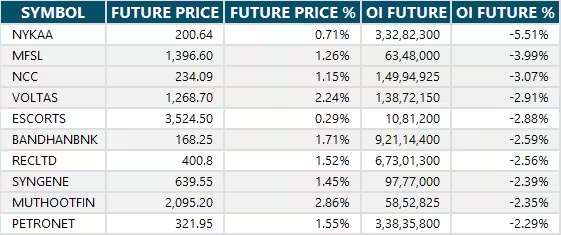
13) Short-Covering (86 Stocks)
86 stocks saw short-covering, meaning a decrease in OI, along with a price increase.
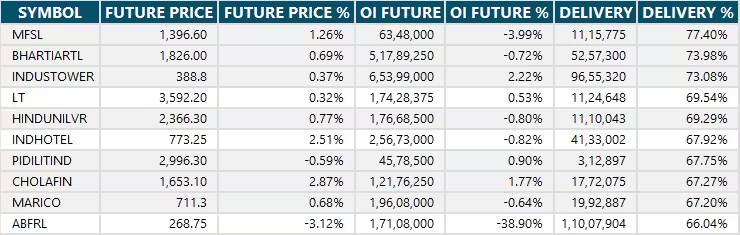
14) High Delivery Trades
Here are the stocks that saw a high share of delivery trades. A high share of delivery reflects investing (as opposed to trading) interest in a stock.
15) Stocks Under F&O Ban
Securities banned under the F&O segment include companies where derivative contracts cross 95 percent of the market-wide position limit.
Stocks added to F&O ban: Titagarh Rail Systems
Stocks retained in F&O ban: Manappuram Finance, RBL Bank
Stocks removed from F&O ban: Nil


0 Comment