23 Jul , 2025 By : Debdeep Gupta

The market failed to see follow-through buying on July 22 due to profit booking at higher levels. The Nifty 50 shed 30 points with above-average volumes after a day of rally. Technical indicators suggest the possibility of continued consolidation until the index clearly negates the lower highs–lower lows formation. According to experts, if the index reclaims and sustains above the 25,250–25,350 zone, buying interest may push it toward 25,550. However, until then, consolidation is likely to continue, with 25,000 acting as psychological support. A breach below this level could open the door to 24,900.
Here are 15 data points we have collated to help you spot profitable trades:
1) Key Levels For The Nifty 50 (25,061)
Resistance based on pivot points: 25,149, 25,183, and 25,239
Support based on pivot points: 25,037, 25,002, and 24,946
Special Formation: The Nifty 50 formed a bearish candle on the daily charts after almost testing the 20-day EMA (25,183), indicating weakness and ongoing consolidation. The index has continued to gyrate within the lower and midline of the Bollinger Bands for the last eight sessions, staying below short-term moving averages. The RSI has remained below the 50 zone at 46.65, with a bearish crossover, and the Stochastic RSI has remained sideways for more than a week now. The MACD histogram showed some further improvement. This indicates continued consolidation and a lack of clear directional strength in the near term.
2) Key Levels For The Bank Nifty (56,756)
Resistance based on pivot points: 57,138, 57,279, and 57,505
Support based on pivot points: 56,684, 56,544, and 56,317
Resistance based on Fibonacci retracement: 57,050, 57,566
Support based on Fibonacci retracement: 56,389, 56,096
Special Formation: The Bank Nifty declined 0.35 percent, forming a long bearish candle on the daily timeframe. It failed to sustain above the midline of the Bollinger Bands, the 20-day EMA, and the upward-sloping support trendline, all signaling consolidation. The MACD histogram continued to show improvement, and the Stochastic RSI displayed a positive crossover, offering a short-term optimistic signal. However, the RSI at 51.48 maintained a negative crossover. This suggests the Bank Nifty may also remain in a consolidation phase unless it breaks decisively above key resistance levels.
3) Nifty Call Options Data
According to the weekly options data, the maximum Call open interest was seen at the 25,100 strike (with 1.27 crore contracts). This level can act as a key resistance for the Nifty in the short term. It was followed by the 25,200 strike (1.26 crore contracts), and the 25,500 strike (1.08 crore contracts).
Maximum Call writing was observed at the 25,200 strike, which saw an addition of 54.76 lakh contracts, followed by the 25,100 and 25,150 strikes, which added 51.8 lakh and 41.28 lakh contracts, respectively. The maximum Call unwinding was seen at the 24,900 strike, which shed 1.18 lakh contracts, followed by the 24,950 and 24,800 strikes, which shed 1.66 lakh and 81,750 contracts, respectively.
4) Nifty Put Options Data
On the Put side, the 25,000 strike holds the maximum Put open interest (with 84.25 lakh contracts), which can act as a key support level for the Nifty. It was followed by the 25,100 strike (75.11 lakh contracts) and the 24,500 strike (70.22 lakh contracts).
The maximum Put writing was placed at the 24,500 strike, which saw an addition of 12.54 lakh contracts, followed by the 24,700 and 25,050 strikes, which added 12.51 lakh and 12.46 lakh contracts, respectively. The maximum Put unwinding was seen at the 24,900 strike, which shed 11.08 lakh contracts, followed by the 24,850 and 24,950 strikes, which shed 1.8 lakh and 1.26 lakh contracts, respectively.
5) Bank Nifty Call Options Data
According to the monthly options data, the 57,000 strike holds the maximum Call open interest, with 19.84 lakh contracts. This can act as a key resistance level for the index in the short term. It was followed by the 57,500 strike (14.86 lakh contracts) and the 58,000 strike (11.74 lakh contracts).
Maximum Call writing was visible at the 57,000 strike (with the addition of 3.06 lakh contracts), followed by the 57,500 strike (2.16 lakh contracts), and the 57,200 strike (1.52 lakh contracts). The maximum Call unwinding was seen at the 56,000 strike, which shed 2.88 lakh contracts, followed by the 56,400 and 56,300 strikes, which shed 11,620 and 10,290 contracts, respectively.
6) Bank Nifty Put Options Data
On the Put side, the maximum Put open interest was placed at the 56,000 strike (with 15.26 lakh contracts), which can act as a key support level for the index. This was followed by the 57,000 strike (10.98 lakh contracts) and the 55,000 strike (9.26 lakh contracts).
The maximum Put writing was observed at the 57,100 strike (which added 88,515 contracts), followed by the 56,300 strike (87,045 contracts) and the 57,000 strike (74,025 contracts). The maximum Put unwinding was seen at the 56,000 strike, which shed 3.91 lakh contracts, followed by the 56,500 and 56,700 strikes, which shed 65,100 and 64,260 contracts, respectively.
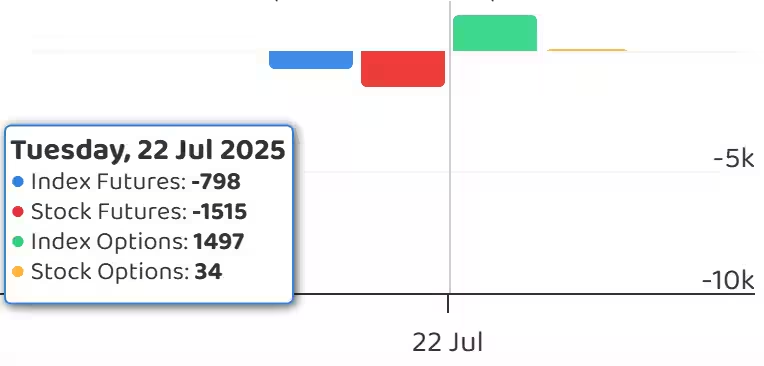
7) Funds Flow (Rs crore)
8) Put-Call Ratio
The Nifty Put-Call ratio (PCR), which indicates the mood of the market, fell to 0.84 on July 22, compared to 0.96 in the previous session.
The increasing PCR, or being higher than 0.7 or surpassing 1, means traders are selling more Put options than Call options, which generally indicates the firming up of a bullish sentiment in the market. If the ratio falls below 0.7 or moves towards 0.5, then it indicates selling in Calls is higher than selling in Puts, reflecting a bearish mood in the market.
9) India VIX
The India VIX, often referred to as the fear gauge, extended its downward move, falling 4.02 percent to 10.75, its lowest closing level since April 2024. Its persistent presence in lower zones indicates stability in the market. However, such low volatility also signals the potential for a major breakout or breakdown in the sessions ahead.
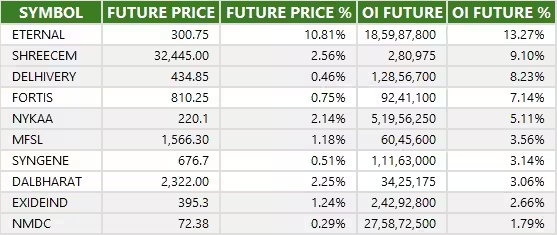
10) Long Build-up (22 Stocks)
A long build-up was seen in 22 stocks. An increase in open interest (OI) and price indicates a build-up of long positions.
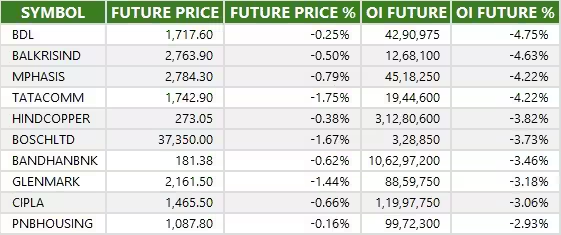
11) Long Unwinding (69 Stocks)
69 stocks saw a decline in open interest (OI) along with a fall in price, indicating long unwinding.
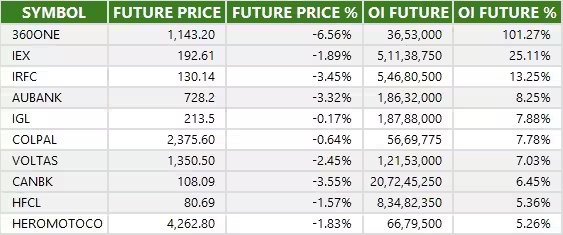
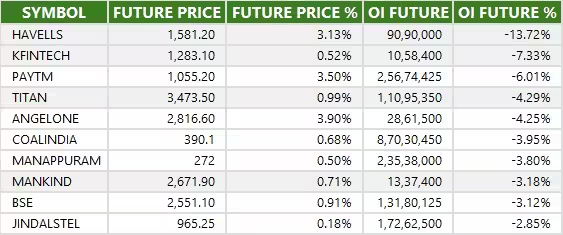
12) Short Build-up (104 Stocks)
104 stocks saw an increase in OI along with a fall in price, indicating a build-up of short positions.
13) Short-Covering (34 Stocks)
34 stocks saw short-covering, meaning a decrease in OI, along with a price increase.
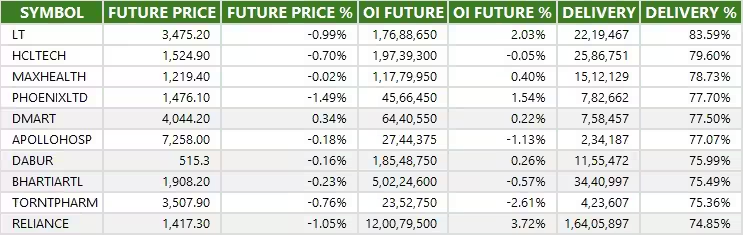
14) High Delivery Trades
Here are the stocks that saw a high share of delivery trades. A high share of delivery reflects investing (as opposed to trading) interest in a stock.
15) Stocks Under F&O Ban
Securities banned under the F&O segment include companies where derivative contracts cross 95 percent of the market-wide position limit.
Stocks added to F&O ban: Indian Energy Exchange
Stocks retained in F&O ban: Bandhan Bank, RBL Bank
Stocks removed from F&O ban: Nil


0 Comment