08 Jul , 2025 By : Debdeep Gupta

The Nifty 50 closed flat after a directionless trading session on July 7 amid low volumes. Market participants are keenly awaiting the India-US trade deal and other tariff-related updates from the Trump administration. The index remained in a tight range of around 80 points and sustained well above the immediate key support zone of 25,300–25,350, continuing its higher highs–higher lows formation. According to experts, if the index decisively breaks below 25,300, then 25,200-25,100 could be the next levels to watch. However, a move above 25,500 on the higher side may drive the index toward the 25,650–25,700 levels.
Here are 15 data points we have collated to help you spot profitable trades:
1) Key Levels For The Nifty 50 (25,461)
Resistance based on pivot points: 25,484, 25,504, and 25,535
Support based on pivot points: 25,421, 25,402, and 25,370
Special Formation: The Nifty 50 formed a Doji-like candlestick pattern on the daily charts, signaling indecision among bulls and bears. The index continued to trade well above short-term moving averages, and the Relative Strength Index (RSI) at 61.02 retained a positive crossover. The Moving Average Convergence Divergence (MACD) also maintained a positive crossover, though the histogram suggests that momentum is consistently fading.
2) Key Levels For The Bank Nifty (56,949)
Resistance based on pivot points: 57,100, 57,174, and 57,294
Support based on pivot points: 56,860, 56,786, and 56,666
Resistance based on Fibonacci retracement: 57,566, 58,224
Support based on Fibonacci retracement: 56,389, 59,096
Special Formation: The Bank Nifty also had a lacklustre session and formed a Doji-like candlestick pattern on the daily timeframe with low volumes. The index continued to trade above short-term moving averages and stayed above the midline of the Bollinger Bands. However, the MACD showed a negative crossover along with a subdued histogram. The RSI at 57.93 and the Stochastic RSI also sustained a negative crossover, signaling some caution for bulls.
3) Nifty Call Options Data
According to the weekly options data, the 26,000 strike holds the maximum Call open interest (with 1.04 crore contracts). This level can act as a key resistance for the Nifty in the short term. It was followed by the 25,500 strike (88.99 lakh contracts), and the 25,600 strike (79.57 lakh contracts).
Maximum Call writing was observed at the 25,600 strike, which saw an addition of 26.48 lakh contracts, followed by the 26,000 and 25,500 strikes, which added 20.49 lakh and 18.73 lakh contracts, respectively. The maximum Call unwinding was seen at the 25,700 strike, which shed 5.04 lakh contracts, followed by the 25,350, and 25,300 strikes, which shed 1.8 lakh and 65,475 contracts, respectively.
4) Nifty Put Options Data
On the Put side, the maximum Put open interest was seen at the 25,000 strike (with 70.17 lakh contracts), which can act as a key support level for the Nifty. It was followed by the 25,300 strike (67.23 lakh contracts) and the 25,400 strike (63.3 lakh contracts).
The maximum Put writing was placed at the 25,300 strike, which saw an addition of 22.87 lakh contracts, followed by the 25,400 and 24,800 strikes, which added 14.33 lakh and 10.68 lakh contracts, respectively. The maximum Put unwinding was seen at the 25,200 strike, which shed 5.88 lakh contracts, followed by the 25,100 and 25,600 strikes, which shed 1.76 lakh and 58,800 contracts, respectively.
5) Bank Nifty Call Options Data
According to the monthly options data, the maximum Call open interest was observed at the 56,000 strike, with 14 lakh contracts. This can act as a key level for the index in the short term. It was followed by the 57,000 strike (11.61 lakh contracts) and the 57,500 strike (9.76 lakh contracts).
Maximum Call writing was visible at the 57,000 strike (with the addition of 68,285 contracts), followed by the 57,500 strike (65,555 contracts), and the 58,000 strike (30,205 contracts). The maximum Call unwinding was seen at the 58,800 strike, which shed 9,485 contracts, followed by the 56,800 and 58,900 strikes, which shed 8,855 and 8,505 contracts, respectively.
6) Bank Nifty Put Options Data
On the Put side, the 56,000 strike holds the maximum Put open interest (with 21.12 lakh contracts), which can act as a key support level for the index. This was followed by the 57,000 strike (12.84 lakh contracts) and the 56,500 strike (5.79 lakh contracts).
The maximum Put writing was observed at the 56,500 strike (which added 24,045 contracts), followed by the 57,200 strike (19,670 contracts) and the 55,900 strike (16,135 contracts). The maximum Put unwinding was seen at the 56,800 strike, which shed 38,920 contracts, followed by the 57,500 and 57,100 strikes, which shed 26,530 and 25,130 contracts, respectively.
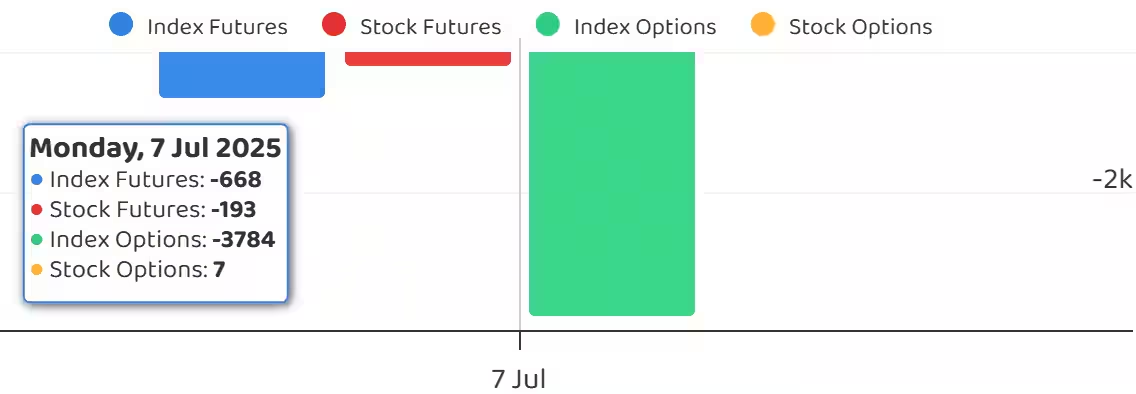
7) Funds Flow (Rs crore)
8) Put-Call Ratio
The Nifty Put-Call ratio (PCR), which indicates the mood of the market, rose to 0.95 on July 7, compared to 0.93 in the previous session.
The increasing PCR, or being higher than 0.7 or surpassing 1, means traders are selling more Put options than Call options, which generally indicates the firming up of a bullish sentiment in the market. If the ratio falls below 0.7 or moves towards 0.5, then it indicates selling in Calls is higher than selling in Puts, reflecting a bearish mood in the market.
9) India VIX
The fear gauge, India VIX, remained in the lower zones despite snapping a four-day losing streak and rising 1.99 percent to 12.56 on Monday, which remains supportive for bulls.
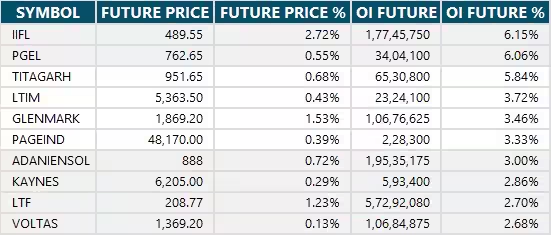
10) Long Build-up (40 Stocks)
A long build-up was seen in 40 stocks. An increase in open interest (OI) and price indicates a build-up of long positions.
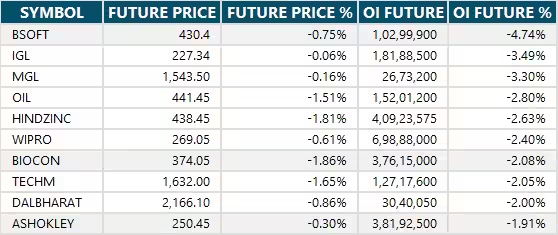
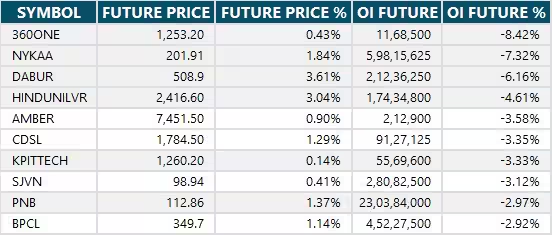
11) Long Unwinding (56 Stocks)
56 stocks saw a decline in open interest (OI) along with a fall in price, indicating long unwinding.
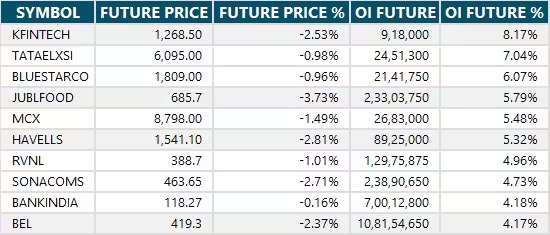
12) Short Build-up (85 Stocks)
85 stocks saw an increase in OI along with a fall in price, indicating a build-up of short positions.
13) Short-Covering (47 Stocks)
47 stocks saw short-covering, meaning a decrease in OI, along with a price increase.
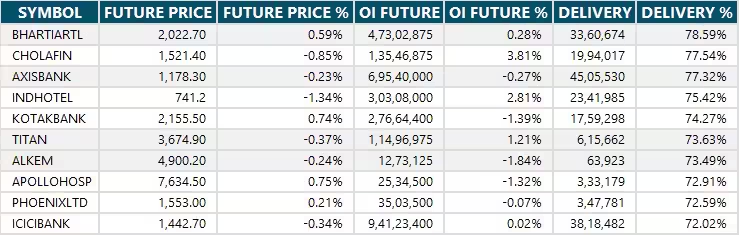
14) High Delivery Trades
Here are the stocks that saw a high share of delivery trades. A high share of delivery reflects investing (as opposed to trading) interest in a stock.
15) Stocks Under F&O Ban
Securities banned under the F&O segment include companies where derivative contracts cross 95 percent of the market-wide position limit.
Stocks added to F&O ban: Nil
Stocks retained in F&O ban: RBL Bank
Stocks removed from F&O ban: Nil


0 Comment