02 Jul , 2025 By : Debdeep Gupta

The Nifty 50 rebounded after a day of profit booking and ended the rangebound session 0.1 percent higher on July 1. The index sustained above 25,500 on a closing basis for another session. Technical indicators suggest a phase of consolidation may continue for a few more sessions following the recent sharp rally, with the 25,650–25,700 zone likely to act as resistance on the upside. Sustaining above this zone could open the door for further gains. On the downside, the 25,400–25,300 area is expected to serve as a support zone, according to experts.
Here are 15 data points we have collated to help you spot profitable trades:
1) Key Levels For The Nifty 50 (25,542)
Resistance based on pivot points: 25,581, 25,602, and 25,637
Support based on pivot points: 25,511, 25,489, and 25,454
Special Formation: The Nifty 50 formed a Doji candlestick pattern on the daily timeframe, indicating indecision among bulls and bears after trading within the previous day's range. The index traded near the upper Bollinger Bands and sustained well above the support trendline. The MACD maintained a positive crossover, though the bullish bias in the histogram appears to be fading. The RSI, at 64.29, sustained its positive crossover. However, the Stochastic RSI gave a negative crossover in the upper band, indicating potential short-term weakness or sideways movement.
2) Key Levels For The Bank Nifty (57,459)
Resistance based on pivot points: 57,528, 57,618, and 57,765
Support based on pivot points: 57,235, 57,144, and 56,998
Resistance based on Fibonacci retracement: 57,566, 58,224
Support based on Fibonacci retracement: 57,032, 56,673
Special Formation: The Bank Nifty formed a small bullish candle with a minor upper shadow and a long lower shadow on the daily chart, accompanied by above-average volumes, reflecting buying interest at lower levels. The index continued to trade near its all-time high and the upper Bollinger Bands, suggesting a positive trend. The MACD retained its positive crossover, with increasing bullish momentum in the histogram. Both the RSI, at 66.51, and the Stochastic RSI maintained positive crossovers, supporting the ongoing bullish sentiment.
3) Nifty Call Options Data
According to the weekly options data, the 26,000 strike holds the maximum Call open interest (with 1.48 crore contracts). This level can act as a key resistance for the Nifty in the short term. It was followed by the 25,600 strike (1.23 crore contracts), and the 25,700 strike (95.34 lakh contracts).
Maximum Call writing was observed at the 26,000 strike, which saw an addition of 25.08 lakh contracts, followed by the 25,600 and 26,150 strikes, which added 20.72 lakh and 19.53 lakh contracts, respectively. The maximum Call unwinding was seen at the 26,400 strike, which shed 8.94 lakh contracts, followed by the 25,800 and 26,250 strikes, which shed 5.56 lakh and 5.55 lakh contracts, respectively.
4) Nifty Put Options Data
On the Put side, the maximum Put open interest was seen at the 25,500 strike (with 1.11 crore contracts), which can act as a key support level for the Nifty. It was followed by the 25,000 strike (84.66 lakh contracts) and the 25,400 strike (74.91 lakh contracts).
The maximum Put writing was placed at the 25,500 strike, which saw an addition of 36.63 lakh contracts, followed by the 25,400 and 24,800 strikes, which added 28.32 lakh and 26.37 lakh contracts, respectively. The maximum Put unwinding was observed at the 25,200 strike, which shed 94,575 contracts, followed by the 25,700 and 25,750 strikes, which shed 52,950 and 24,375 contracts, respectively.
5) Bank Nifty Call Options Data
According to the monthly options data, the maximum Call open interest was placed at the 56,000 strike, with 14.19 lakh contracts. This can act as a key level for the index in the short term. It was followed by the 58,000 strike (8.99 lakh contracts) and the 59,000 strike (7.9 lakh contracts).
Maximum Call writing was visible at the 59,000 strike (with the addition of 1.25 lakh contracts), followed by the 58,000 strike (91,770 contracts), and the 57,500 strike (45,500 contracts). The maximum Call unwinding was seen at the 57,000 strike, which shed 39,375 contracts, followed by the 57,400 and 58,300 strikes, which shed 21,245 and 9,275 contracts, respectively.
6) Bank Nifty Put Options Data
On the Put side, the 56,000 strike holds the maximum Put open interest (with 21.18 lakh contracts), which can act as a key support level for the index. This was followed by the 57,000 strike (12.04 lakh contracts) and the 57,500 strike (6.08 lakh contracts).
The maximum Put writing was observed at the 57,500 strike (which added 1.77 lakh contracts), followed by the 57,200 strike (92,750 contracts) and the 57,000 strike (82,145 contracts). The maximum Put unwinding was seen at the 56,100 strike, which shed 1,505 contracts, followed by the 58,100 and 58,700 strikes, which shed 490 and 70 contracts, respectively.
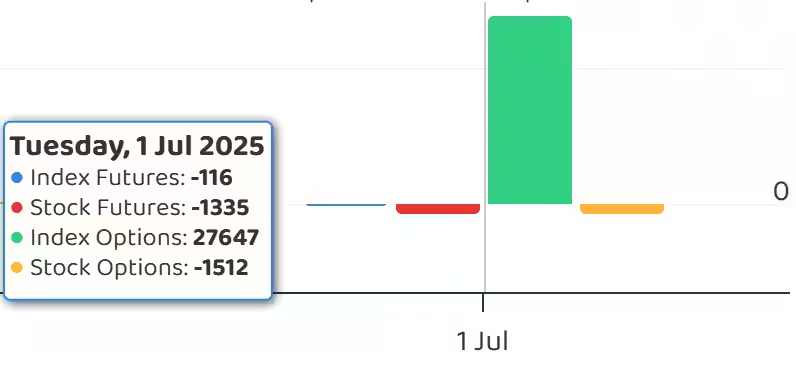
7) Funds Flow (Rs crore)
8) Put-Call Ratio
The Nifty Put-Call ratio (PCR), which indicates the mood of the market, climbed to 0.88 on July 1, compared to 0.81 in the previous session.
The increasing PCR, or being higher than 0.7 or surpassing 1, means traders are selling more Put options than Call options, which generally indicates the firming up of a bullish sentiment in the market. If the ratio falls below 0.7 or moves towards 0.5, then it indicates selling in Calls is higher than selling in Puts, reflecting a bearish mood in the market.
9) India VIX
The fear gauge, India VIX, remained in the lower zone, falling 2.01 percent to 12.53 levels, which continues to be a comfort zone for bulls.
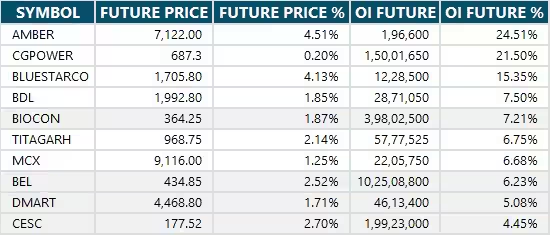
10) Long Build-up (63 Stocks)
A long build-up was seen in 63 stocks. An increase in open interest (OI) and price indicates a build-up of long positions.
11) Long Unwinding (30 Stocks)
30 stocks saw a decline in open interest (OI) along with a fall in price, indicating long unwinding.
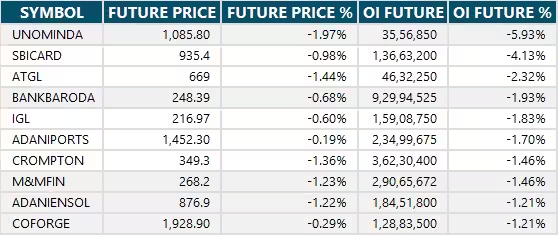
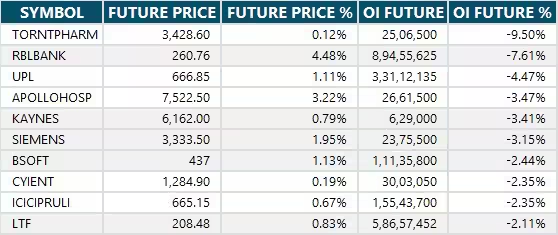
12) Short Build-up (91 Stocks)
91 stocks saw an increase in OI along with a fall in price, indicating a build-up of short positions.
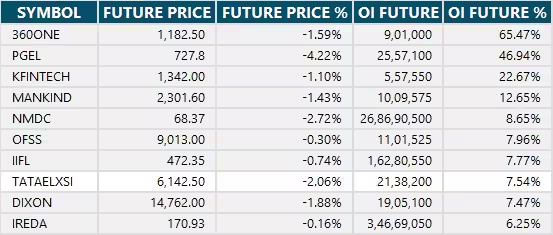
13) Short-Covering (41 Stocks)
41 stocks saw short-covering, meaning a decrease in OI, along with a price increase.
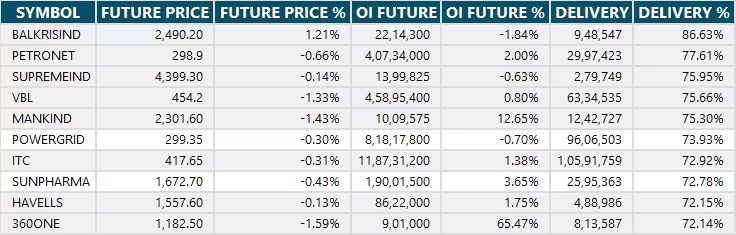
14) High Delivery Trades
Here are the stocks that saw a high share of delivery trades. A high share of delivery reflects investing (as opposed to trading) interest in a stock.
15) Stocks Under F&O Ban
Securities banned under the F&O segment include companies where derivative contracts cross 95 percent of the market-wide position limit.
Stocks added to F&O ban: Nil
Stocks retained in F&O ban: RBL Bank
Stocks removed from F&O ban: Nil


0 Comment