03 Jul , 2025 By : Debdeep Gupta

The Nifty 50 remained consolidative and witnessed selling pressure on July 2, falling below the 25,500 mark to end the session 0.35 percent lower. The chart formation and technical indicators signal further consolidation in the coming sessions until the index reclaims and sustains above the current week's high. Broadly, it is expected to trade in the range of 25,200–25,700 in the near term. A decisive close above 25,700 can drive the index toward 26,000; however, a fall below 25,200 may bring the bears into full action, according to experts.
Here are 15 data points we have collated to help you spot profitable trades:
1) Key Levels For The Nifty 50 (25,453)
Resistance based on pivot points: 25,568, 25,622, and 25,709
Support based on pivot points: 25,393, 25,338, and 25,251
Special Formation: The Nifty 50 formed a bearish candle with a minor lower shadow on the daily timeframe, following a Doji formation in the previous session. This signals weakness; however, the overall trend remains positive, as the index continues to trade well above the short-term moving averages and the midline of the Bollinger Bands. The Stochastic RSI sustained a negative crossover, while the RSI, although tilted downward, stayed above the 60 mark, closing at 61.34, indicating moderate strength.
2) Key Levels For The Bank Nifty (56,999)
Resistance based on pivot points: 57,457, 57,645, and 57,948
Support based on pivot points: 56,850, 56,663, and 56,359
Resistance based on Fibonacci retracement: 57,566, 58,224
Support based on Fibonacci retracement: 56,673, 56,384
Special Formation: The Bank Nifty saw the formation of a sizeable bearish candle on the daily charts with above-average volumes, indicating a negative trend amid likely consolidation. Still, the index remains above key short-term moving averages and the midline of Bollinger Bands, which is a positive signal. The MACD continues to show a positive crossover, but the momentum, as seen in the histogram, appears to be fading. The RSI drifted below the 60 mark, closing at 59.57 and trending downward, signaling weakening momentum in the near term. Meanwhile, the Stochastic RSI gave a negative crossover, further confirming short-term weakness.
3) Nifty Call Options Data
According to the weekly options data, the maximum Call open interest remained at the 26,000 strike (with 1.75 crore contracts). This level can act as a key resistance for the Nifty in the short term. It was followed by the 25,600 strike (1.65 crore contracts), and the 25,500 strike (1.45 crore contracts).
Maximum Call writing was observed at the 25,500 strike, which saw an addition of 59.76 lakh contracts, followed by the 25,450 and 25,600 strikes, which added 42.33 lakh and 41.38 lakh contracts, respectively. The maximum Call unwinding was seen at the 26,300 strike, which shed 16.7 lakh contracts, followed by the 26,200 and 26,150 strikes, which shed 15.17 lakh and 14.67 lakh contracts, respectively.
4) Nifty Put Options Data
On the Put side, the 25,000 strike holds the maximum Put open interest (with 1 crore contracts), which can act as a key support level for the Nifty. It was followed by the 25,400 strike (78.21 lakh contracts) and the 25,300 strike (66.52 lakh contracts).
The maximum Put writing was placed at the 25,000 strike, which saw an addition of 15.72 lakh contracts, followed by the 25,350 and 25,150 strikes, which added 11.81 lakh and 11.53 lakh contracts, respectively. The maximum Put unwinding was observed at the 25,500 strike, which shed 45.3 lakh contracts, followed by the 25,550 and 25,600 strikes, which shed 23.75 lakh and 22.33 lakh contracts, respectively.
5) Bank Nifty Call Options Data
According to the monthly options data, the 56,000 strike holds the maximum Call open interest, with 14.11 lakh contracts. This can act as a key level for the index in the short term. It was followed by the 58,000 strike (9.53 lakh contracts) and the 57,000 strike (9.19 lakh contracts).
Maximum Call writing was visible at the 57,500 strike (with the addition of 1.94 lakh contracts), followed by the 57,000 strike (1.9 lakh contracts), and the 57,200 strike (1.14 lakh contracts). The maximum Call unwinding was seen at the 56,000 strike, which shed 7,980 contracts, followed by the 56,700 and 56,500 strikes, which shed 4,550 and 2,730 contracts, respectively.
6) Bank Nifty Put Options Data
On the Put side, the maximum Put open interest was seen at the 56,000 strike (with 21.58 lakh contracts), which can act as a key support level for the index. This was followed by the 57,000 strike (12.04 lakh contracts) and the 55,500 strike (5.58 lakh contracts).
The maximum Put writing was observed at the 56,000 strike (which added 39,970 contracts), followed by the 55,500 strike (37,380 contracts) and the 56,900 strike (23,065 contracts). The maximum Put unwinding was seen at the 57,500 strike, which shed 1.33 lakh contracts, followed by the 57,400 and 57,200 strikes, which shed 80,150 and 68,425 contracts, respectively.
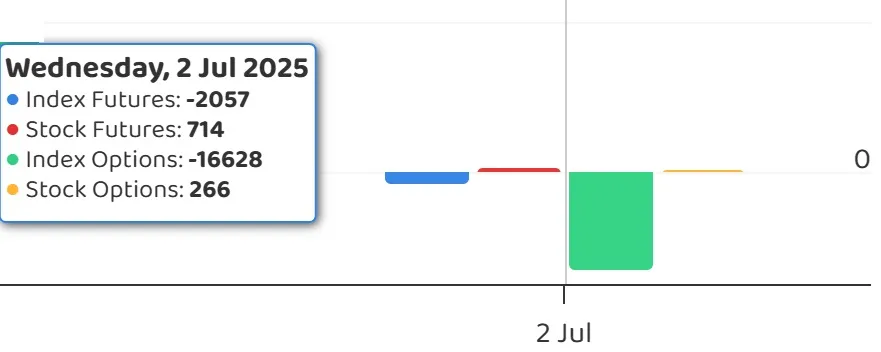
7) Funds Flow (Rs crore)
8) Put-Call Ratio
The Nifty Put-Call ratio (PCR), which indicates the mood of the market, declined to 0.78 on July 2, compared to 0.88 in the previous session.
The increasing PCR, or being higher than 0.7 or surpassing 1, means traders are selling more Put options than Call options, which generally indicates the firming up of a bullish sentiment in the market. If the ratio falls below 0.7 or moves towards 0.5, then it indicates selling in Calls is higher than selling in Puts, reflecting a bearish mood in the market.
9) India VIX
The India VIX, which measures expected market volatility, remained below the 13 mark, falling 0.66 percent to 12.44 levels. This continues to indicate a comfort zone for the bulls.
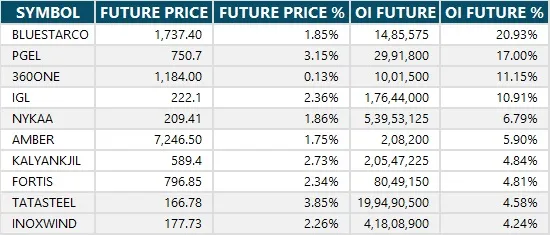
10) Long Build-up (62 Stocks)
A long build-up was seen in 62 stocks. An increase in open interest (OI) and price indicates a build-up of long positions.
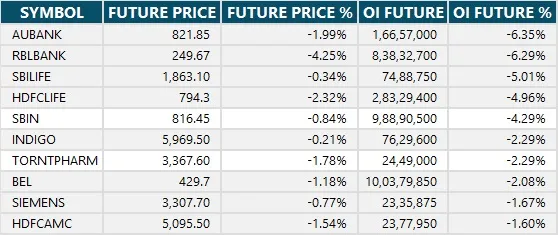
11) Long Unwinding (46 Stocks)
46 stocks saw a decline in open interest (OI) along with a fall in price, indicating long unwinding.
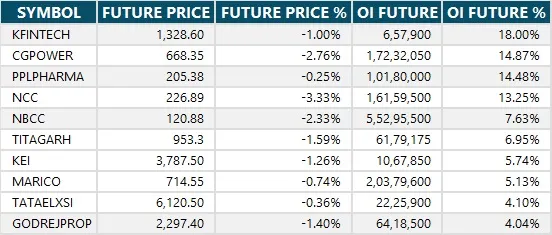
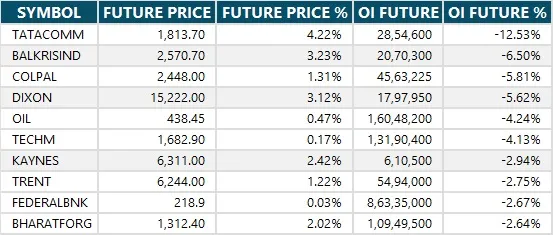
12) Short Build-up (77 Stocks)
77 stocks saw an increase in OI along with a fall in price, indicating a build-up of short positions.
13) Short-Covering (43 Stocks)
43 stocks saw short-covering, meaning a decrease in OI, along with a price increase.
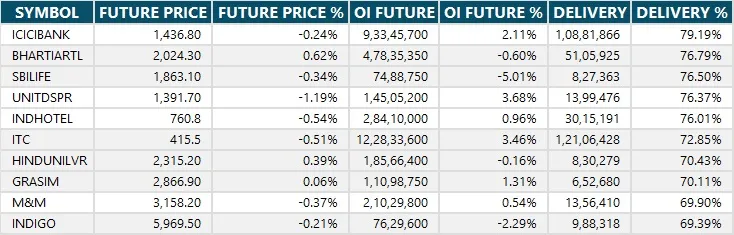
14) High Delivery Trades
Here are the stocks that saw a high share of delivery trades. A high share of delivery reflects investing (as opposed to trading) interest in a stock.
15) Stocks Under F&O Ban
Securities banned under the F&O segment include companies where derivative contracts cross 95 percent of the market-wide position limit.
Stocks added to F&O ban: Nil
Stocks retained in F&O ban: RBL Bank
Stocks removed from F&O ban: Nil


0 Comment