04 Jul , 2025 By : Debdeep Gupta

The Nifty 50 was weak for another session but managed to defend the previous day's low and traded within Wednesday's range, falling 0.2 percent on July 3. The momentum indicators RSI and Stochastic RSI signaled the possibility of further consolidation. In case the index rebounds while defending the 25,400–25,380 zone (the low of the previous two sessions), the 25,500–25,600 range is the level to watch on the higher side. However, a decisive breakdown below these levels could drag the benchmark index toward the support zone of 25,350–25,250 (10-day EMA and upward-sloping resistance trendline turning into support), according to experts.
Here are 15 data points we have collated to help you spot profitable trades:
1) Key Levels For The Nifty 50 (25,405)
Resistance based on pivot points: 25,537, 25,585, and 25,662
Support based on pivot points: 25,381, 25,333, and 25,256
Special Formation: The Nifty 50 formed a bearish candle with an upper shadow on the daily charts, indicating a continuation of consolidation with a negative bias. The overall trend remains positive as long as the index holds above short-term moving averages (10-day and 20-day EMAs) and the midline of the Bollinger Bands. The MACD tilted down slightly, with fading momentum in the histogram, though it still holds a positive crossover. The Stochastic RSI sustained its negative crossover, and the RSI (at 59.74) is on the verge of a negative crossover.
2) Key Levels For The Bank Nifty (56,792)
Resistance based on pivot points: 57,080, 57,182, and 57,345
Support based on pivot points: 56,752, 56,651, and 56,487
Resistance based on Fibonacci retracement: 57,566, 58,224
Support based on Fibonacci retracement: 56,681, 56,389
Special Formation: The Bank Nifty retreated from the upper line of the Bollinger Bands and moved closer to the mid-band, forming a lower high–lower low pattern. The index formed a bearish candle with a minor upper shadow on the daily timeframe, signaling pressure at higher levels. It closed below the 10-day EMA, and sustaining below this level could invite further selling pressure. The RSI at 56.70 showed a negative crossover, while the Stochastic RSI remained in a negative crossover. The MACD is on the verge of a negative crossover, all of which indicate the likelihood of continued consolidation with a negative bias.
3) Nifty Call Options Data
According to the weekly options data, the 25,500 strike holds the maximum Call open interest (with 63.48 lakh contracts). This level can act as a key resistance for the Nifty in the short term. It was followed by the 26,000 strike (62.27 lakh contracts), and the 25,600 strike (44.2 lakh contracts).
Maximum Call writing was observed at the 25,500 strike, which saw an addition of 34.48 lakh contracts, followed by the 26,000 and 25,900 strikes, which added 27.38 lakh and 26.15 lakh contracts, respectively. There was hardly any Call unwinding seen in the 24,700-26,350 strike band.
4) Nifty Put Options Data
On the Put side, the maximum Put open interest was seen at the 25,000 strike (with 54.28 lakh contracts), which can act as a key support level for the Nifty. It was followed by the 25,500 strike (45.23 lakh contracts) and the 25,400 strike (30.71 lakh contracts).
The maximum Put writing was placed at the 25,000 strike, which saw an addition of 30.27 lakh contracts, followed by the 25,500 and 25,400 strikes, which added 20.38 lakh and 17.39 lakh contracts, respectively. There was hardly any Put unwinding seen in the 24,600-26,350 strike band.
5) Bank Nifty Call Options Data
According to the monthly options data, the maximum Call open interest was seen at the 56,000 strike, with 14.03 lakh contracts. This can act as a key level for the index in the short term. It was followed by the 57,000 strike (10.04 lakh contracts) and the 58,000 strike (9.52 lakh contracts).
Maximum Call writing was visible at the 57,000 strike (with the addition of 85,785 contracts), followed by the 57,900 strike (78,645 contracts), and the 59,000 strike (57,260 contracts). The maximum Call unwinding was seen at the 56,000 strike, which shed 7,805 contracts, followed by the 56,300 and 56,400 strikes, which shed 1,960 and 1,225 contracts, respectively.
6) Bank Nifty Put Options Data
On the Put side, the 56,000 strike holds the maximum Put open interest (with 21.27 lakh contracts), which can act as a key support level for the index. This was followed by the 57,000 strike (12.2 lakh contracts) and the 55,500 strike (5.68 lakh contracts).
The maximum Put writing was observed at the 56,800 strike (which added 41,265 contracts), followed by the 56,900 strike (22,400 contracts) and the 57,000 strike (16,030 contracts). The maximum Put unwinding was seen at the 56,000 strike, which shed 30,590 contracts, followed by the 56,500 and 57,300 strikes, which shed 30,415 and 27,055 contracts, respectively.
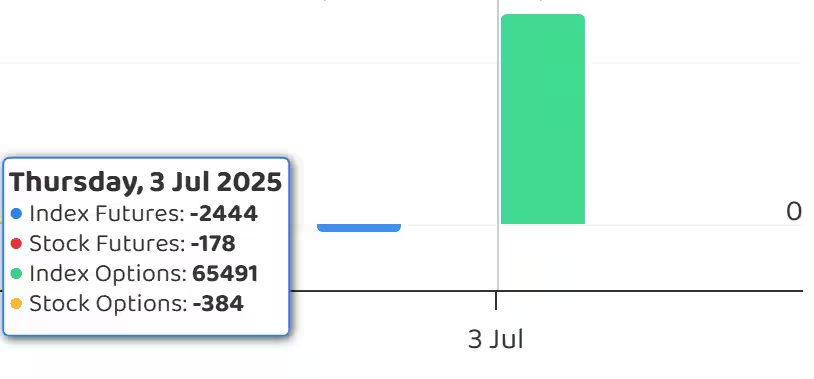
7) Funds Flow (Rs crore)
8) Put-Call Ratio
The Nifty Put-Call ratio (PCR), which indicates the mood of the market, jumped to 0.99 on July 3, compared to 0.78 in the previous session.
The increasing PCR, or being higher than 0.7 or surpassing 1, means traders are selling more Put options than Call options, which generally indicates the firming up of a bullish sentiment in the market. If the ratio falls below 0.7 or moves towards 0.5, then it indicates selling in Calls is higher than selling in Puts, reflecting a bearish mood in the market.
9) India VIX
The fear index India VIX remained in the lower zone and extended its downtrend for the third consecutive session, falling 0.48 percent to 12.39 levels. This continues to remain favourable for the bulls.
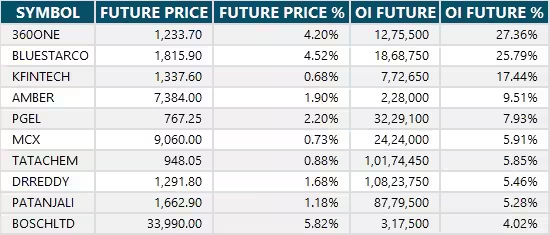
10) Long Build-up (44 Stocks)
A long build-up was seen in 44 stocks. An increase in open interest (OI) and price indicates a build-up of long positions.
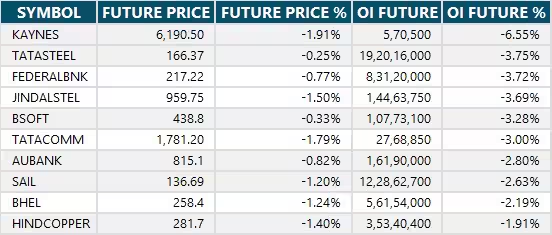
11) Long Unwinding (55 Stocks)
55 stocks saw a decline in open interest (OI) along with a fall in price, indicating long unwinding.
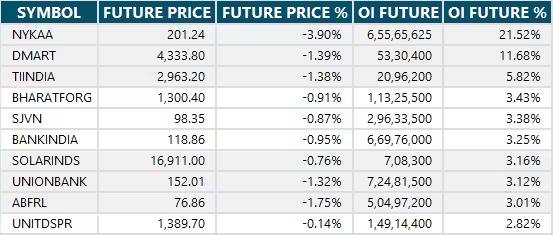
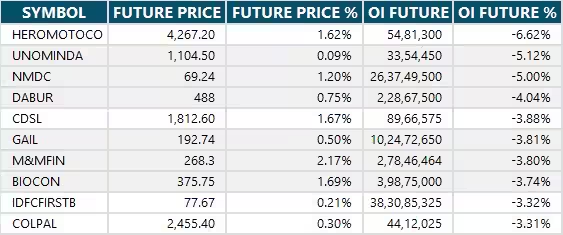
12) Short Build-up (81 Stocks)
81 stocks saw an increase in OI along with a fall in price, indicating a build-up of short positions.
13) Short-Covering (48 Stocks)
48 stocks saw short-covering, meaning a decrease in OI, along with a price increase.
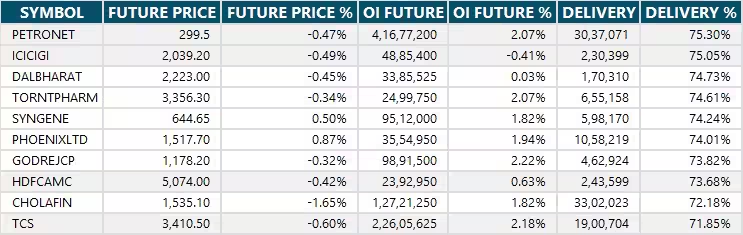
14) High Delivery Trades
Here are the stocks that saw a high share of delivery trades. A high share of delivery reflects investing (as opposed to trading) interest in a stock.
15) Stocks Under F&O Ban
Securities banned under the F&O segment include companies where derivative contracts cross 95 percent of the market-wide position limit.
Stocks added to F&O ban: Nil
Stocks retained in F&O ban: RBL Bank
Stocks removed from F&O ban: Nil


0 Comment