05 Aug , 2025 By : Debdeep Gupta

The Nifty 50 saw a pullback rally on August 4 after a more than 1 percent loss in the previous week. However, the lower highs–lower lows formation remains intact, with bearish signals continuing from momentum indicators. Hence, unless and until the index closes and sustains above the short- and medium-term moving averages, the trend is likely to favour the bears. On the higher side, 24,800 is expected to act as an immediate hurdle, followed by 24,950 as a key resistance level. On the lower side, support is placed in the 24,500–24,550 zone; a breakdown below this range could give bears further strength, according to experts.
Here are 15 data points we have collated to help you spot profitable trades:
1) Key Levels For The Nifty 50 (24,723)
Resistance based on pivot points: 24,741, 24,784, and 24,853
Support based on pivot points: 24,601, 24,558, and 24,489
Special Formation: The Nifty 50 formed a bullish candle on the daily charts, which, along with the previous day's bearish candle, indicates a pullback rally within a bearish market. The index climbed above the 100-day EMA but remained below the 20-day and 50-day EMAs. Additionally, the MACD is still below the signal line (red line), though the weakness in the histogram is fading slightly. The RSI saw an uptick to the 41.83 zone but still shows a bearish crossover.
2) Key Levels For The Bank Nifty (55,619)
Resistance based on pivot points: 55,723, 55,798, and 55,918
Support based on pivot points: 55,483, 55,408, and 55,288
Resistance based on Fibonacci retracement: 55,962, 56,281
Support based on Fibonacci retracement: 55,150, 54,471
Special Formation: The Bank Nifty formed a small green candle with both upper and lower shadows on the daily timeframe, indicating range-bound movement and indecision among bulls and bears. The index closed flat, remaining below the 50-day EMA for the third consecutive session and continuing the lower highs–lower lows formation. The MACD stayed below the zero line, with bearishness visible in the histogram, while the RSI remained below 40, at 38.43, with a bearish crossover.
3) Nifty Call Options Data
According to the weekly options data, the 25,000 strike holds the maximum Call open interest (with 1.06 crore contracts). This level can act as a key resistance for the Nifty in the short term. It was followed by the 25,500 strike (88 lakh contracts), and the 24,800 strike (80.14 lakh contracts).
Maximum Call writing was observed at the 25,500 strike, which saw an addition of 15.9 lakh contracts, followed by the 25,300 and 25,100 strikes, which added 14.13 lakh and 11.33 lakh contracts, respectively. The maximum Call unwinding was seen at the 24,800 strike, which shed 14.42 lakh contracts, followed by the 24,700 and 24,600 strikes, which shed 13.78 lakh and 13.56 lakh contracts, respectively.
4) Nifty Put Options Data
On the Put side, the maximum Put open interest was observed at the 24,000 strike (with 81.89 lakh contracts), which can act as a key support level for the Nifty. It was followed by the 24,600 strike (78.23 lakh contracts) and the 24,500 strike (72.64 lakh contracts).
The maximum Put writing was placed at the 24,600 strike, which saw an addition of 38.71 lakh contracts, followed by the 24,700 and 24,500 strikes, which added 29.5 lakh and 29.11 lakh contracts, respectively. The maximum Put unwinding was seen at the 24,200 strike, which shed 16.05 lakh contracts, followed by the 24,900 and 25,000 strikes, which shed 2.82 lakh and 96,450 contracts, respectively.
5) Bank Nifty Call Options Data
According to the monthly options data, the maximum Call open interest was seen at the 57,000 strike, with 21.34 lakh contracts. This can act as a key resistance level for the index in the short term. It was followed by the 56,000 strike (9.78 lakh contracts) and the 56,500 strike (6.04 lakh contracts).
Maximum Call writing was visible at the 55,600 strike (with the addition of 1.15 lakh contracts), followed by the 55,700 strike (78,750 contracts), and the 55,500 strike (74,515 contracts). The maximum Call unwinding was seen at the 56,900 strike, which shed 9,695 contracts, followed by the 54,000 and 54,500 strikes, which shed 3,990 and 1,155 contracts, respectively.
6) Bank Nifty Put Options Data
On the Put side, the 57,000 strike holds the maximum Put open interest (with 14.04 lakh contracts), which can act as a key level for the index. This was followed by the 56,000 strike (9.34 lakh contracts) and the 55,000 strike (8.44 lakh contracts).
The maximum Put writing was observed at the 55,500 strike (which added 1.22 lakh contracts), followed by the 55,600 strike (96,985 contracts) and the 54,000 strike (57,925 contracts). The maximum Put unwinding was seen at the 56,500 strike, which shed 26,880 contracts, followed by the 56,200 and 54,500 strikes, which shed 20,510 and 18,725 contracts, respectively.
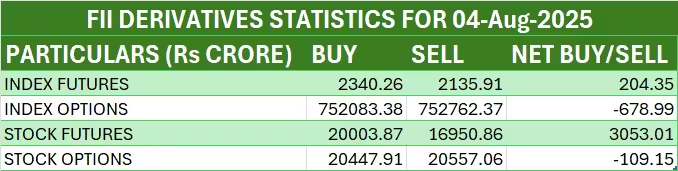
7) Funds Flow (Rs crore)
8) Put-Call Ratio
The Nifty Put-Call ratio (PCR), which indicates the mood of the market, jumped to 0.94 on August 4, compared to 0.75 in the previous session.
The increasing PCR, or being higher than 0.7 or surpassing 1, means traders are selling more Put options than Call options, which generally indicates the firming up of a bullish sentiment in the market. If the ratio falls below 0.7 or moves towards 0.5, then it indicates selling in Calls is higher than selling in Puts, reflecting a bearish mood in the market.
9) India VIX
The India VIX, which measures expected market volatility, stayed above short-term moving averages and climbed up to the 12.63 zone intraday before closing at 11.97, down 0.06 percent. Overall, this signals a degree of caution for the bulls.
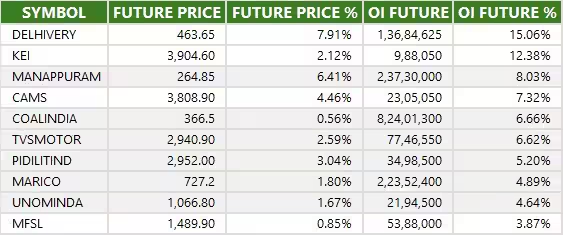
10) Long Build-up (93 Stocks)
A long build-up was seen in 93 stocks. An increase in open interest (OI) and price indicates a build-up of long positions.
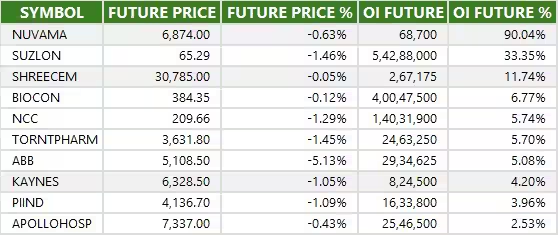
11) Long Unwinding (9 Stocks)
9 stocks saw a decline in open interest (OI) along with a fall in price, indicating long unwinding.
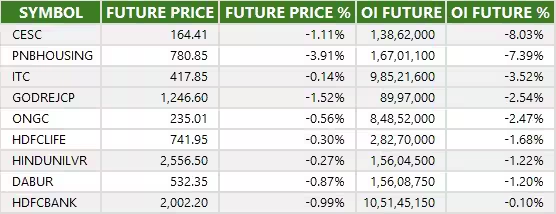
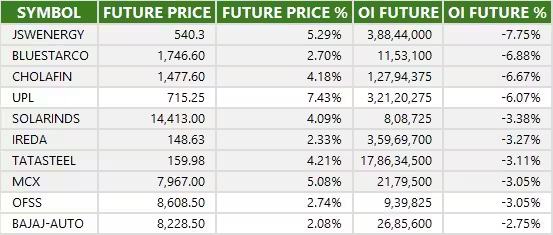
12) Short Build-up (19 Stocks)
19 stocks saw an increase in OI along with a fall in price, indicating a build-up of short positions.
13) Short-Covering (100 Stocks)
100 stocks saw short-covering, meaning a decrease in OI, along with a price increase.
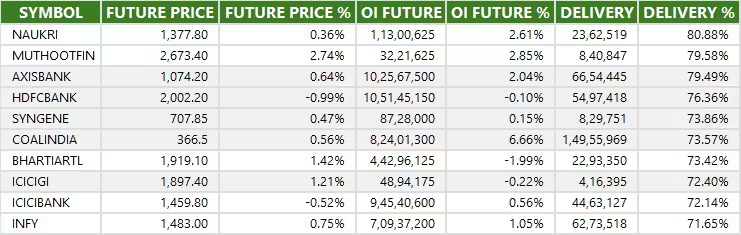
14) High Delivery Trades
Here are the stocks that saw a high share of delivery trades. A high share of delivery reflects investing (as opposed to trading) interest in a stock.
15) Stocks Under F&O Ban
Securities banned under the F&O segment include companies where derivative contracts cross 95 percent of the market-wide position limit.
Stocks added to F&O ban: Nil
Stocks retained in F&O ban: PNB Housing Finance
Stocks removed from F&O ban: Nil


0 Comment