28 Jan , 2026 By : Debdeep Gupta

The Nifty 50 bounced back with half a percent gains following nearly a percent loss in the previous session, climbing back above the 200-day EMA with healthy volumes on January 27, the monthly F&O expiry session. However, technical and momentum indicators still favour bears, with a cautious signal from the rising VIX. Experts expect the benchmark index to remain in the 24,900–25,500 range in the short term, as a decisive fall below 24,900 can drive the index down to 24,600. However, a convincing rise above 25,500 can open the door for a move toward the 25,600–25,750 levels.
Here are 15 data points we have collated to help you spot profitable trades:
1) Key Levels For The Nifty 50 (25,175)
Resistance based on pivot points: 25,238, 25,312, and 25,432
Support based on pivot points: 24,998, 24,924, and 24,804
Special Formation: The Nifty 50 formed a bullish candle with upper and lower shadows on the daily timeframe, indicating positivity amid volatility, but it could not close above the previous day’s high. The index climbed above the 200-day EMA but remained below all other key moving averages, with the 10-day EMA sustaining below the 20-, 50-, and 100-day EMAs. The RSI rose to 34.29, near the oversold zone but still below the signal line. The MACD remained well below the zero and reference lines, though the Stochastic RSI maintained an uptrend with a positive crossover. All this indicates cautious undertones.
2) Key Levels For The Bank Nifty (59,205)
Resistance based on pivot points: 59,424, 59,734, and 60,236
Support based on pivot points: 58,419, 58,108, and 57,606
Resistance based on Fibonacci retracement: 59,550, 59,936
Support based on Fibonacci retracement: 57,824, 57,015
Special Formation: The Bank Nifty reported a long bullish candle on the daily charts with above-average volumes, which is positive, but it could not sustain above the previous day’s high on a closing basis. The index tested the 100-day EMA in the initial minutes of correction but rebounded immediately to climb above the 50-day EMA on a closing basis, while also touching short-term moving averages intraday. The RSI climbed toward the signal line to 48.51, and the Stochastic RSI turned bullish in the oversold zone, while the MACD sustained below the reference and zero lines, though histogram weakness faded slightly. All this indicates improving but cautious momentum.
3) Nifty Call Options Data
According to the weekly options data, the 25,500 strike holds the maximum Call open interest (with 36.65 lakh contracts). This level can act as a key resistance level for the Nifty in the short term. It was followed by the 25,000 strike (27.55 lakh contracts) and 25,200 strike (27.13 lakh contracts).
Maximum Call writing was observed at the 25,000 strike strike, which saw an addition of 21.43 lakh contracts, followed by the 25,200 and 25,500 strikes, which added 16.65 lakh and 16.49 lakh contracts, respectively. There was hardly any Call unwinding seen in the 24,400-25,900 strike band.
4) Nifty Put Options Data
On the Put side, the maximum Put open interest was seen at the 25,000 strike (with 42.02 lakh contracts), which can act as a key support level for the Nifty in the short term. It was followed by the 25,200 strike (21.02 lakh contracts) and the 25,100 strike (20.88 lakh contracts).
The maximum Put writing was placed at the 25,000 strike, which saw an addition of 31.19 lakh contracts, followed by the 25,100 and 25,200 strikes, which added 15.02 lakh and 11.08 lakh contracts, respectively. There was hardly any Put unwinding seen in the 24,400-25,900 strike band.
5) Bank Nifty Call Options Data
According to the monthly options data, the 60,000 strike holds the maximum Call open interest, with 16.07 lakh contracts. This can act as a key resistance level for the index in the short term. It was followed by the 61,000 strike (3.89 lakh contracts) and the 59,000 strike (3.06 lakh contracts).
Maximum Call writing was observed at the 60,000 strike (with the addition of 1.24 lakh contracts), followed by the 61,000 strike (1.02 lakh contracts) and 59,100 strike (54,900 contracts). The maximum Call unwinding was seen at the 58,500 strike, which shed 8,580 contracts, followed by the 58,900 and 58,600 strikes which shed 3,030 and 2,490 contracts, respectively.
6) Bank Nifty Put Options Data
On the Put side, the maximum Put open interest was seen at the 60,000 strike (with 13.49 lakh contracts), which can act as a key level for the index. This was followed by the 58,000 strike (6.29 lakh contracts) and the 59,000 strike (4.42 lakh contracts).
The maximum Put writing was placed at the 58,500 strike (which added 1.26 lakh contracts), followed by the 58,000 strike (91,650 contracts) and the 59,000 strike (82,080 contracts). There was hardly any Put unwinding seen in the 57,250-61,000 strike band.
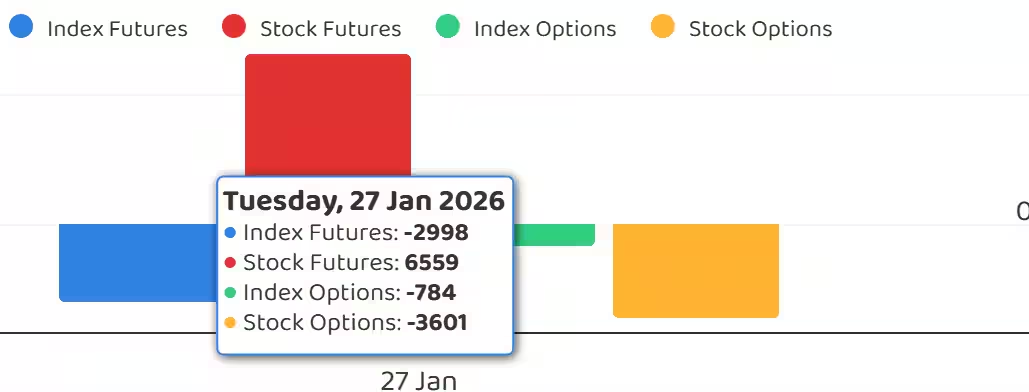
7) Funds Flow (Rs crore)
8) Put-Call Ratio
The Nifty Put-Call ratio (PCR), which indicates the mood of the market, jumped to 1.02 on January 27, compared to 0.7 in the previous session.
The increasing PCR, or being higher than 0.7 or surpassing 1, means traders are selling more Put options than Call options, which generally indicates the firming up of a bullish sentiment in the market. If the ratio falls below 0.7 or moves towards 0.5, then it indicates selling in Calls is higher than selling in Puts, reflecting a bearish mood in the market.
9) India VIX
The fear index, India VIX, jumped to 16.06 intraday but managed to cool off and settle at 14.45, up 1.83 percent, signalling continued discomfort for bulls.
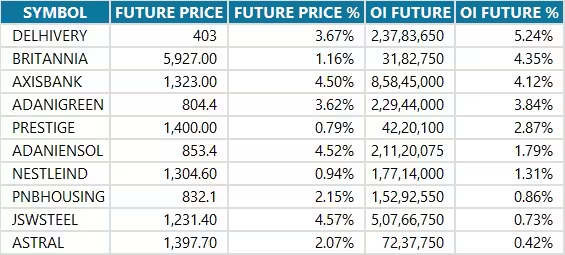
10) Long Build-up (10 Stocks)
A long build-up was seen in 10 stocks. An increase in open interest (OI) and price indicates a build-up of long positions.
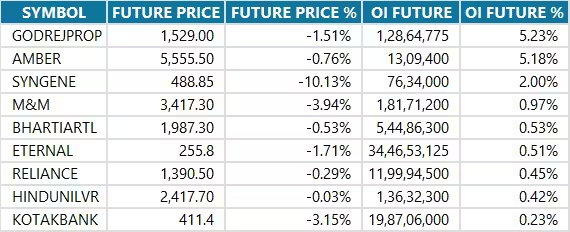
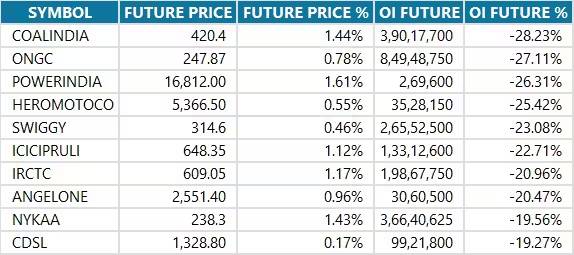
11) Long Unwinding (48 Stocks)
48 stocks saw a decline in open interest (OI) along with a fall in price, indicating long unwinding.
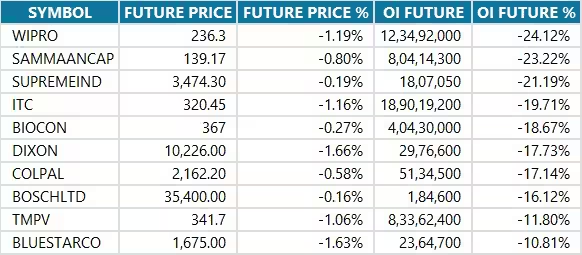
12) Short Build-up (9 Stocks)
9 stocks saw an increase in OI along with a fall in price, indicating a build-up of short positions.
13) Short-Covering (145 Stocks)
145 stocks saw short-covering, meaning a decrease in OI, along with a price increase.
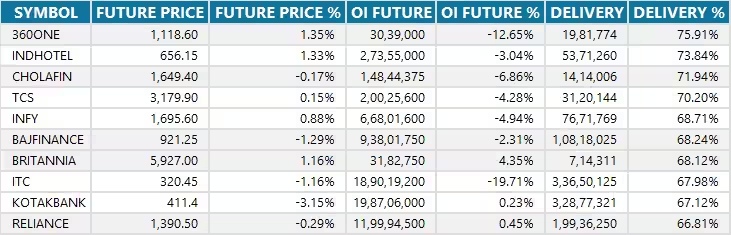
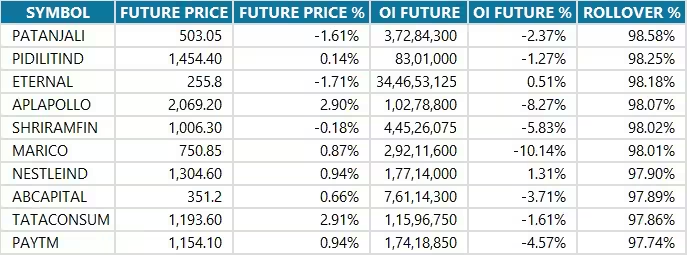
14) High Delivery Trades, and High Rollovers
Here are the stocks that saw a high share of delivery trades. A high share of delivery reflects investing (as opposed to trading) interest in a stock.
Here are the stocks which saw the highest rollovers on expiry day.
15) Stocks Under F&O Ban
Securities banned under the F&O segment include companies where derivative contracts cross 95 percent of the market-wide position limit.
Stocks added to F&O ban: Nil
Stocks retained in F&O ban: Nil
Stocks removed from F&O ban: Sammaan Capital


0 Comment