15 Sep , 2025 By : Debdeep Gupta

The Nifty 50 continued its upward journey for the eighth consecutive session on September 12, rising 0.4 percent to close at its highest level since July 23 this year. The index has been sustaining well above key moving averages, with short- and medium-term moving averages trending upward. Bullish crossovers in momentum indicators have also supported market sentiment. Hence, as long as the index holds above the 25,000 level, the 25,250–25,550 range could be the next levels to watch. However, if it slips below this mark, the 24,800 level—where the 20-day and 50-day EMAs as well as the midline of the Bollinger Bands converge—could act as a crucial support, according to experts.
Here are 15 data points we have collated to help you spot profitable trades:
1) Key Levels For The Nifty 50 (25,114)
Resistance based on pivot points: 25,136, 25,160, and 25,198
Support based on pivot points: 25,058, 25,035, and 24,996
Special Formation: The Nifty 50 formed a bullish candlestick with both upper and lower shadows after a positive opening, signaling a healthy trend despite volatility. The index is now approaching its August high, a key level that could help negate the lower highs–lower lows structure. Notably, the 20-day EMA is on the verge of surpassing the 50-day EMA, and the 10-day EMA is already positioned above both the 20- and 50-day EMAs, while the RSI climbed to 61, indicating strength, supported by a strong bullish crossover. The MACD remained above the zero line, with further positive trend visible in the histogram. All of these indicators point toward continued bullish momentum.
2) Key Levels For The Bank Nifty (54,809)
Resistance based on pivot points: 54,851, 54,915, and 55,019
Support based on pivot points: 54,643, 54,579, and 54,476
Resistance based on Fibonacci retracement: 55,115, 55,595
Support based on Fibonacci retracement: 54,392, 53,392
Special Formation: The Bank Nifty formed a Doji-like candlestick pattern on the daily timeframe, indicating indecision among bulls and bears. Still, the index managed to sustain above its 10- and 20-day EMAs, and even touched the 100-day EMA intraday on Friday. The RSI maintained its positive crossover, rising to 49.68. The MACD continued to exhibit a bullish crossover, though still below the zero line, with further strength in the histogram. These signals indicate potential consolidation with a positive bias, as bulls and bears remain in a temporary standoff.
3) Nifty Call Options Data
According to the weekly options data, the maximum Call open interest was seen at the 26,000 strike (with 1.29 crore contracts). This level can act as a key resistance for the Nifty in the short term. It was followed by the 25,500 strike (1.19 crore contracts), and the 25,200 strike (99.93 lakh contracts).
Maximum Call writing was observed at the 25,150 strike, which saw an addition of 23.91 lakh contracts, followed by the 25,351 and 25,300 strikes, which added 21.66 lakh and 21.61 lakh contracts, respectively. The maximum Call unwinding was seen at the 25,000 strike, which shed 44.46 lakh contracts, followed by the 25,050 and 25,700 strikes, which shed 27.52 lakh and 15.61 lakh contracts, respectively.
4) Nifty Put Options Data
On the Put side, the 25,000 strike holds the maximum Put open interest (with 1.78 crore contracts), which can act as a key support level for the Nifty. It was followed by the 25,100 strike (1.23 crore contracts) and the 24,900 strike (1.07 crore contracts).
The maximum Put writing was placed at the 25,100 strike, which saw an addition of 95.61 lakh contracts, followed by the 25,050 and 25,150 strikes, which added 46.44 lakh and 32.01 lakh contracts, respectively. There was hardly any Put unwinding seen in the 24,500-26,000 strike band.
5) Bank Nifty Call Options Data
According to the monthly options data, the 57,000 strike holds the maximum Call open interest, with 18.28 lakh contracts. This can act as a key resistance level for the index in the short term. It was followed by the 55,000 strike (13.17 lakh contracts) and the 56,000 strike (12.49 lakh contracts).
Maximum Call writing was observed at the 55,000 strike (with the addition of 1.03 lakh contracts), followed by the 54,800 strike (51,170 contracts), and the 56,100 strike (51,100 contracts). The maximum Call unwinding was seen at the 54,600 strike, which shed 1.28 lakh contracts, followed by 54,500 and 54,000 strikes, which shed 1.13 lakh and 59,145 contracts, respectively.
6) Bank Nifty Put Options Data
On the Put side, the maximum Put open interest was seen at the 54,000 strike (with 13.85 lakh contracts), which can act as a key support level for the index. This was followed by the 57,000 strike (10.48 lakh contracts) and the 54,500 strike (9.83 lakh contracts).
The maximum Put writing was observed at the 55,000 strike (which added 1.19 lakh contracts), followed by the 54,800 strike (1.16 lakh contracts) and the 53,200 strike (69,440 contracts). The maximum Put winding was seen at the 54,200 strike, which shed 80,990 contracts, followed by the 54,500 and 53,100 strikes, which shed 69,020 and 25,200 contracts, respectively.
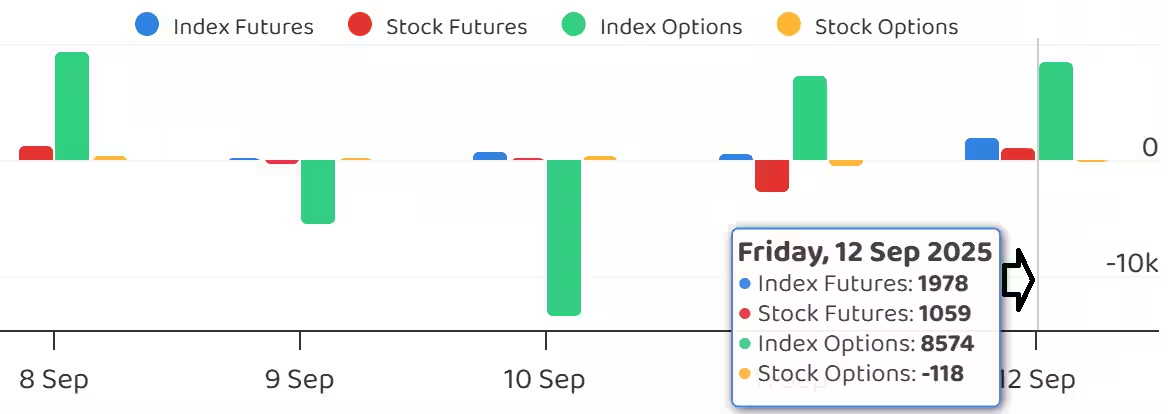
7) Funds Flow (Rs crore)
8) Put-Call Ratio
The Nifty Put-Call ratio (PCR), which indicates the mood of the market, jumped to 1.29 on September 12, compared to 1.17 in the previous session.
The increasing PCR, or being higher than 0.7 or surpassing 1, means traders are selling more Put options than Call options, which generally indicates the firming up of a bullish sentiment in the market. If the ratio falls below 0.7 or moves towards 0.5, then it indicates selling in Calls is higher than selling in Puts, reflecting a bearish mood in the market.
9) India VIX
The India VIX, also known as the fear index, extended its downtrend for the fourth consecutive session, falling 2.29 percent to 10.12—its lowest all-time closing level. This sharp drop strongly favours the bulls, contributing to market stability and reduced uncertainty.
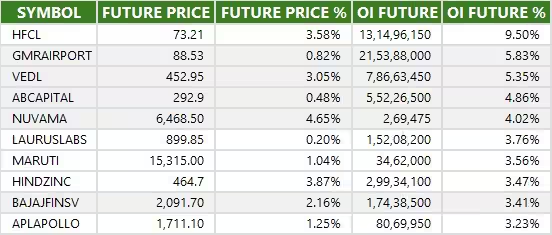
10) Long Build-up (60 Stocks)
A long build-up was seen in 60 stocks. An increase in open interest (OI) and price indicates a build-up of long positions.
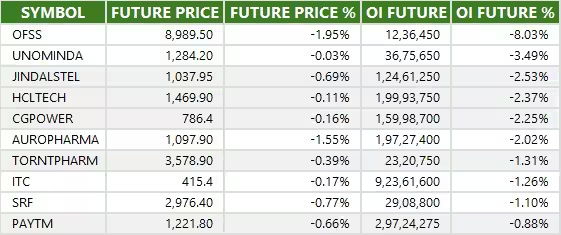
11) Long Unwinding (30 Stocks)
30 stocks saw a decline in open interest (OI) along with a fall in price, indicating long unwinding.
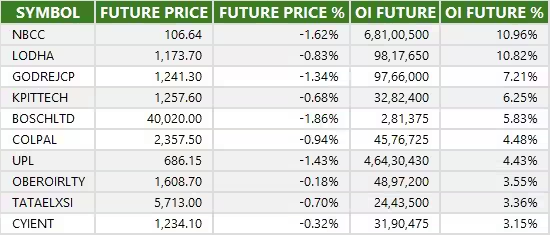
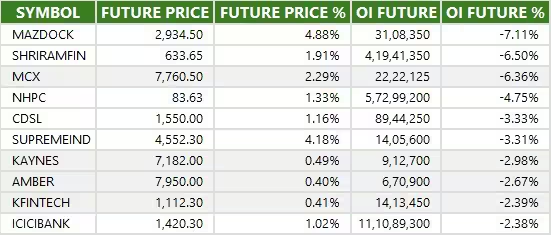
12) Short Build-up (65 Stocks)
65 stocks saw an increase in OI along with a fall in price, indicating a build-up of short positions.
13) Short-Covering (59 Stocks)
59 stocks saw short-covering, meaning a decrease in OI, along with a price increase.
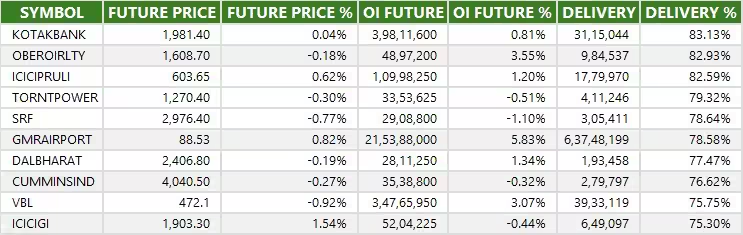
14) High Delivery Trades
Here are the stocks that saw a high share of delivery trades. A high share of delivery reflects investing (as opposed to trading) interest in a stock.
15) Stocks Under F&O Ban
Securities banned under the F&O segment include companies where derivative contracts cross 95 percent of the market-wide position limit.
Stocks added to F&O ban: HFCL
Stocks retained in F&O ban: Oracle Financial Services Software, RBL Bank
Stocks removed from F&O ban: Nil


0 Comment