20 Mar , 2025 By : Debdeep Gupta

The Nifty 50 remained in positive territory for three consecutive days and reached a one-month closing high with a 0.3 percent gain on March 19, as market participants awaited the outcome of the FOMC meeting, during which the central bank held interest rates steady and still signaled two rate cuts in 2025. The index sustained levels above short-term moving averages (10 and 20-day EMAs), with a continuation of the higher high-higher low formation, which is positive. The trend remains healthy and may drive the index toward the 23,000-23,100 zone in the upcoming sessions. However, in case of consolidation, support is placed at the 22,800-22,750 levels, experts said.
Here are 15 data points we have collated to help you spot profitable trades:
1) Key Levels For The Nifty 50 (22,908)
Resistance based on pivot points: 22,936, 22,967, and 23,018
Support based on pivot points: 22,835, 22,803, and 22,753
Special Formation: The Nifty 50 formed a small bullish candlestick pattern with upper and lower shadows on the daily charts, indicating some breather-like market movement after the stellar performance in the previous sessions. The trading volume was above average. Furthermore, the higher highs-higher lows formation was sustained for the second consecutive session, with short-term moving averages trending upward. The momentum indicator RSI (Relative Strength Index at 56.08) maintained a positive bias.
2) Key Levels For The Bank Nifty (49,703)
Resistance based on pivot points: 49,796, 49,910, and 50,094
Support based on pivot points: 49,427, 49,313, and 49,129
Resistance based on Fibonacci retracement: 50,283, 51,089
Support based on Fibonacci retracement: 47,883, 46,078
Special Formation: The Bank Nifty outperformed the benchmark Nifty 50, rising 0.8 percent, and formed a bullish candlestick pattern on the daily timeframe. The index reached the upper end of the Bollinger Bands, and short-term moving averages are now trending upward. The index sustained a higher highs-higher lows formation for the fifth consecutive session, with the RSI climbing above the 60 mark (at 60.92), signaling strong upward momentum.
3) Nifty Call Options Data
According to the weekly options data, the maximum Call open interest was seen at the 23,300 strike (with 1.46 crore contracts). This level can act as a key resistance for the Nifty in the short term. It was followed by the 23,000 strike (1.21 crore contracts), and the 23,100 strike (99.62 lakh contracts).
Maximum Call writing was observed at the 23,300 strike, which saw an addition of 91.93 lakh contracts, followed by the 23,100 and 22,900 strikes, which added 46.8 lakh and 38.73 lakh contracts, respectively. The maximum Call unwinding was seen at the 22,850 strike, which shed 41.27 lakh contracts, followed by the 23,500 and 22,800 strikes, which shed 26.98 lakh and 19.58 lakh contracts, respectively.
4) Nifty Put Options Data
On the Put side, the 22,500 strike holds the maximum Put open interest (with 1.35 crore contracts), which can act as a key support level for the Nifty. It was followed by the 22,800 strike (92.08 lakh contracts) and the 22,300 strike (90.27 lakh contracts).
The maximum Put writing was placed at the 22,900 strike, which saw an addition of 55.66 lakh contracts, followed by the 22,800 and 22,950 strikes, which added 29.46 lakh and 20.76 lakh contracts, respectively. The maximum Put unwinding was seen at the 22,600 strike, which shed 23.46 lakh contracts, followed by the 22,100 and 22,150 strikes, which shed 14.76 lakh and 7.99 lakh contracts, respectively.
5) Bank Nifty Call Options Data
According to the monthly options data, the 51,000 strike holds the maximum Call open interest, with 14.08 lakh contracts. This can act as a key resistance level for the index in the short term. It was followed by the 50,000 strike (12.7 lakh contracts) and the 49,000 strike (12.41 lakh contracts).
Maximum Call writing was visible at the 49,700 strike (with the addition of 1.44 lakh contracts), followed by the 49,800 strike (1.05 lakh contracts) and the 50,500 strike (73,020 contracts). The maximum Call unwinding was seen at the 49,000 strike, which shed 2.14 lakh contracts, followed by the 51,500 and 49,200 strikes, which shed 1.53 lakh and 1.51 lakh contracts, respectively.
6) Bank Nifty Put Options Data
On the Put side, the maximum Put open interest was seen at the 49,000 strike (with 21.84 lakh contracts), which can act as a key support level for the index. This was followed by the 48,000 strike (19.8 lakh contracts) and the 48,500 strike (12.98 lakh contracts).
The maximum Put writing was observed at the 49,500 strike (which added 4.97 lakh contracts), followed by the 49,800 strike (3.1 lakh contracts) and the 49,700 strike (2.96 lakh contracts). The maximum Put unwinding was seen at the 51,000 strike, which shed 44,670 contracts, followed by the 48,900 and 49,100 strikes which shed 40,590 and 29,730 contracts, respectively.
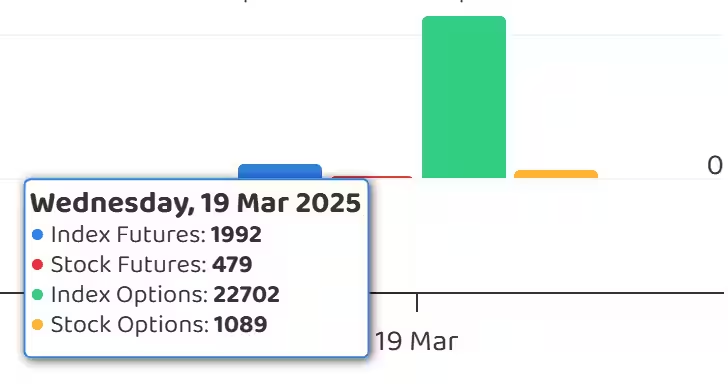
7) Funds Flow (Rs crore)
8) Put-Call Ratio
The Nifty Put-Call ratio (PCR), which indicates the mood of the market, fell to 1.2 on March 19, against 1.29 in the previous session.
The increasing PCR, or being higher than 0.7 or surpassing 1, means traders are selling more Put options than Call options, which generally indicates the firming up of a bullish sentiment in the market. If the ratio falls below 0.7 or moves towards 0.5, then it indicates selling in Calls is higher than selling in Puts, reflecting a bearish mood in the market.
9) India VIX
The India VIX, which measures expected market volatility, increased by 0.66 percent to 13.3, but remained in the lower zone and below all key moving averages, keeping the bulls in the comfort zone.
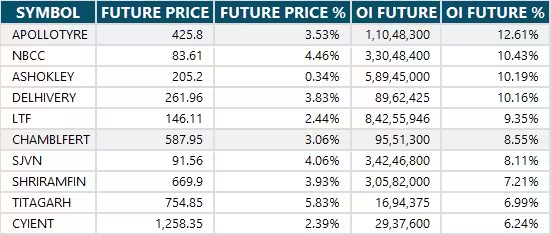
10) Long Build-up (97 Stocks)
A long build-up was seen in 97 stocks. An increase in open interest (OI) and price indicates a build-up of long positions.
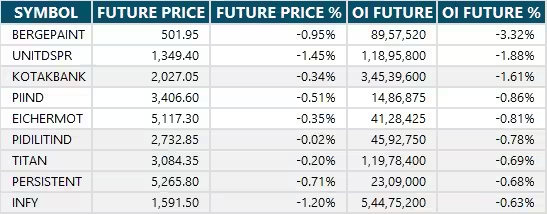
11) Long Unwinding (9 Stocks)
9 stocks saw a decline in open interest (OI) along with a fall in price, indicating long unwinding.
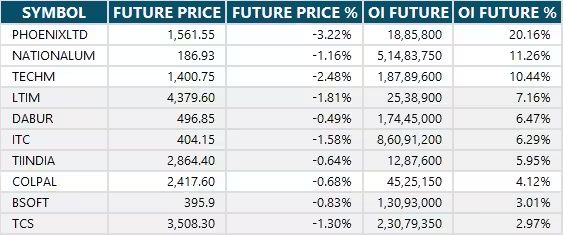
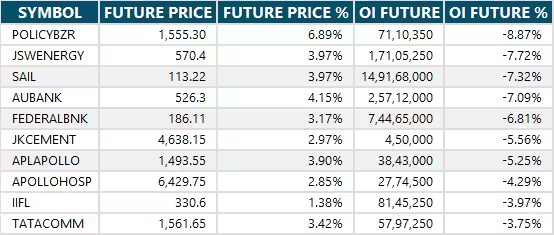
12) Short Build-up (26 Stocks)
26 stocks saw an increase in OI along with a fall in price, indicating a build-up of short positions.
13) Short-Covering (88 Stocks)
88 stocks saw short-covering, meaning a decrease in OI, along with a price increase.
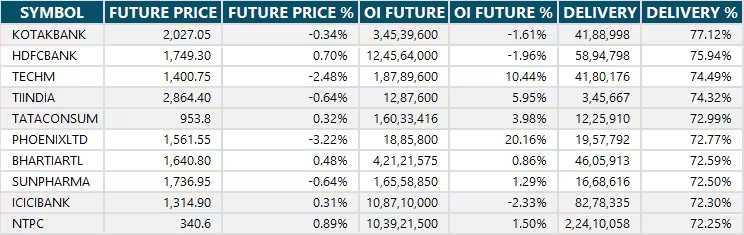
14) High Delivery Trades
Here are the stocks that saw a high share of delivery trades. A high share of delivery reflects investing (as opposed to trading) interest in a stock.
15) Stocks Under F&O Ban
Securities banned under the F&O segment include companies where derivative contracts cross 95 percent of the market-wide position limit.
Stocks added to F&O ban:
Stocks retained in F&O ban: Hindustan Copper, IndusInd Bank, SAIL
Stocks removed from F&O ban: BSE, Manappuram Finance


0 Comment