20 May , 2025 By : Debdeep Gupta

The Nifty 50 continued to consolidate on May 19, closing the session 74 points lower amid rangebound trading. Despite this, the continuation of higher tops and bottoms suggests that the trend remains favourable for bulls. However, in the immediate term, consolidation and minor weakness cannot be ruled out. The expected trading range could be within the 24,800–25,200 zone in the short term. A decisive break below 24,800 could trigger major selling pressure, whereas a break above 25,200 may open the doors for a move towards 25,500–25,700, experts said.
Here are 15 data points we have collated to help you spot profitable trades:
1) Key Levels For The Nifty 50 (24,945)
Resistance based on pivot points: 25,031, 25,065, and 25,121
Support based on pivot points: 24,919, 24,885, and 24,829
Special Formation: The Nifty formed a small bearish candle with a minor upper shadow on the daily charts, indicating consolidation following the strong rally last Thursday. The index remains near the upper line of the Bollinger Bands and is trading well above all key moving averages (20-day, 50-day, and 200-day EMAs). The MACD (Moving Average Convergence Divergence) continues to maintain a positive crossover, while the RSI (Relative Strength Index) is on the verge of a negative crossover, though it still holds above the 60 mark, currently at 63.61.
2) Key Levels For The Bank Nifty (55,421)
Resistance based on pivot points: 55,623, 55,718, and 55,870
Support based on pivot points: 55,319, 55,224, and 55,072
Resistance based on Fibonacci retracement: 56,314, 58,658
Support based on Fibonacci retracement: 54,136, 52,894
Special Formation: The Bank Nifty made an attempt to break the consolidation on the higher side but failed to sustain the momentum and closed below 55,500, gaining 66 points. The index formed a small bullish candle with an upper shadow on the daily timeframe, indicating selling pressure at higher levels. It continues to trade above all key moving averages, while the RSI (61.45) appears to be on the verge of a breakout. The MACD, although still well above the zero line, has shown a negative crossover.
3) Nifty Call Options Data
According to the weekly options data, the maximum Call open interest was placed at the 25,000 strike (with 1.1 crore contracts). This level can act as a key resistance for the Nifty in the short term. It was followed by the 25,500 strike (98.18 lakh contracts), and the 25,200 strike (74.49 lakh contracts).
Maximum Call writing was observed at the 25,000 strike, which saw an addition of 52.39 lakh contracts, followed by the 25,200 and 25,800 strikes, which added 28.69 lakh and 22.75 lakh contracts, respectively. The maximum Call unwinding was seen at the 25,450 strike, which shed 1.78 lakh contracts, followed by the 24,600 and 24,700 strikes, which shed 28,350 and 21,225 contracts, respectively.
4) Nifty Put Options Data
On the Put side, the 24,000 strike holds the maximum Put open interest (with 64.92 lakh contracts), which can act as a key support level for the Nifty. It was followed by the 25,000 strike (64.3 lakh contracts) and the 24,500 strike (54.7 lakh contracts).
The maximum Put writing was placed at the 24,200 strike, which saw an addition of 13.31 lakh contracts, followed by the 24,900 and 24,400 strikes, which added 7.81 lakh and 5.44 lakh contracts, respectively. The Put unwinding was seen at the 25,100 strike, which shed 2.12 lakh contracts, followed by the 24,300 and 25,000 strikes which shed 59,400 and 24,750 contracts, respectively.
5) Bank Nifty Call Options Data
According to the monthly options data, the maximum Call open interest was seen at the 55,500 strike, with 12.79 lakh contracts. This can act as a key resistance level for the index in the short term. It was followed by the 56,000 strike (12.52 lakh contracts) and the 57,000 strike (10.28 lakh contracts).
Maximum Call writing was visible at the 56,500 strike (with the addition of 1.43 lakh contracts), followed by the 55,600 strike (1.41 lakh contracts), and the 55,700 strike (1.23 lakh contracts). The maximum Call unwinding was seen at the 55,300 strike, which shed 70,110 contracts, followed by the 55,000 and 55,200 strikes, which shed 50,460 and 19,710 contracts, respectively.
6) Bank Nifty Put Options Data
On the Put side, the 55,000 strike holds the maximum Put open interest (with 20.25 lakh contracts), which can act as a key support level for the index. This was followed by the 54,000 strike (11.74 lakh contracts) and the 55,500 strike (8.63 lakh contracts).
The maximum Put writing was observed at the 55,000 strike (which added 70,410 contracts), followed by the 55,700 strike (67,170 contracts) and the 55,600 strike (60,780 contracts). The maximum Put unwinding was seen at the 54,000 strike, which shed 83,700 contracts, followed by the 55,300 and 54,800 strikes, which shed 49,110 and 46,680 contracts, respectively.
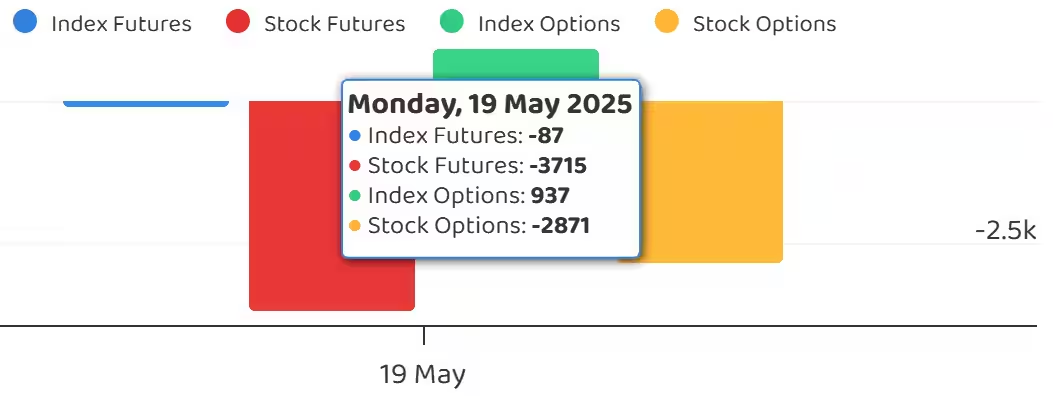
7) Funds Flow (Rs crore)
8) Put-Call Ratio
The Nifty Put-Call ratio (PCR), which indicates the mood of the market, fell further to 0.82 on May 19, from 0.97 in the previous session.
The increasing PCR, or being higher than 0.7 or surpassing 1, means traders are selling more Put options than Call options, which generally indicates the firming up of a bullish sentiment in the market. If the ratio falls below 0.7 or moves towards 0.5, then it indicates selling in Calls is higher than selling in Puts, reflecting a bearish mood in the market.
9) India VIX
The India VIX, often referred to as the fear gauge, rebounded sharply, rising 4.86 percent to 17.36 levels, after a downtrend throughout the previous week. This signals a slightly cautious tone for bulls in the market.
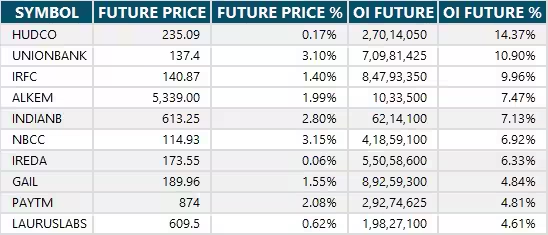
10) Long Build-up (60 Stocks)
A long build-up was seen in 60 stocks. An increase in open interest (OI) and price indicates a build-up of long positions.
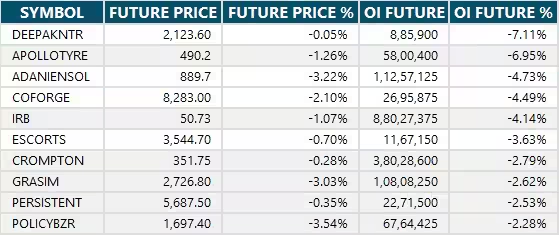
11) Long Unwinding (45 Stocks)
45 stocks saw a decline in open interest (OI) along with a fall in price, indicating long unwinding.
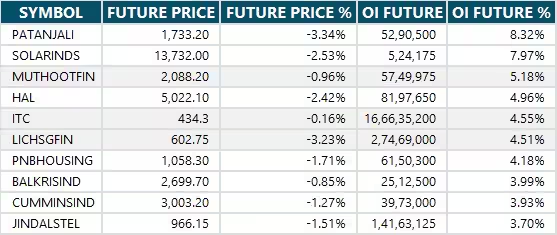
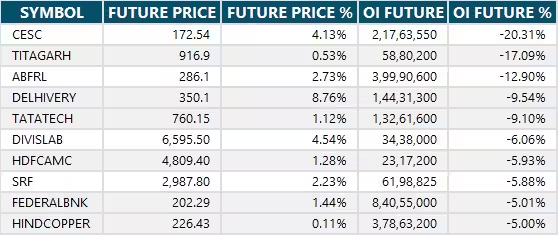
12) Short Build-up (66 Stocks)
66 stocks saw an increase in OI along with a fall in price, indicating a build-up of short positions.
13) Short-Covering (50 Stocks)
50 stocks saw short-covering, meaning a decrease in OI, along with a price increase.
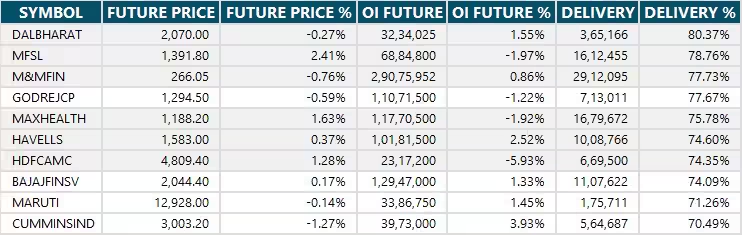
14) High Delivery Trades
Here are the stocks that saw a high share of delivery trades. A high share of delivery reflects investing (as opposed to trading) interest in a stock.
15) Stocks Under F&O Ban
Securities banned under the F&O segment include companies where derivative contracts cross 95 percent of the market-wide position limit.
Stocks added to F&O ban: Nil
Stocks retained in F&O ban: Hindustan Copper, Manappuram Finance, Titagarh Rail Systems
Stocks removed from F&O ban: Nil


0 Comment