25 Apr , 2025 By : Debdeep Gupta

The Nifty 50 snapped its seven-day winning streak and closed 0.3 percent lower on April 24, the expiry day for April F&O contracts, due to profit booking, after trading within the previous day's range. This warranted consolidation is expected to continue over the next couple of sessions, with crucial support at 24,000 (the 50 percent Fibonacci retracement). According to experts, if this support holds, the index may gain strength for a further upmove toward 24,545 (the 61.8 percent retracement), as the overall trend remains positive.
Here are 15 data points we have collated to help you spot profitable trades:
1) Key Levels For The Nifty 50 (24,247)
Resistance based on pivot points: 24,321, 24,352, and 24,402
Support based on pivot points: 24,220, 24,189, and 24,139
Special Formation: The Nifty 50 formed a small bearish candle with an upper shadow on the daily charts, signaling pressure at higher levels. However, the broader trend remains strong, considering the index is trading well above all key moving averages. Notably, the 20-day EMA has decisively crossed above both the 50-day and 200-day EMAs. Furthermore, the index continues to hold well above the 50 percent Fibonacci retracement level.
2) Key Levels For The Bank Nifty (55,201)
Resistance based on pivot points: 55,457, 55,566, and 55,742
Support based on pivot points: 55,104, 54,995, and 54,818
Resistance based on Fibonacci retracement: 56,307, 58,648
Support based on Fibonacci retracement: 54,117, 52,891
Special Formation: The Bank Nifty formed a small bullish candlestick pattern with a long upper shadow on the daily timeframe, indicating selling pressure at higher levels. Nevertheless, the index sustained above the 55,000 zone, which acts as immediate support, followed by the 54,700 level—representing the upper end of the bullish gap zone from April 21. All key moving averages (20-, 50-, and 200-day EMAs) are trending upward, with above-average volumes observed despite the consolidation. The MACD showed that momentum is fading but still reflects a positive crossover well above the zero line. Meanwhile, the RSI (Relative Strength Index) at 72.27 tilted downward but remains in the upper band.
3) Nifty Call Options Data
According to the weekly options data, the maximum Call open interest was seen was seen at the 25,000 strike (with 58.51 lakh contracts). This level can act as a key resistance for the Nifty in the short term. It was followed by the 24,500 strike (38.11 lakh contracts), and the 24,300 strike (31.82 lakh contracts).
Maximum Call writing was observed at the 25,000 strike, which saw an addition of 18.83 lakh contracts, followed by the 24,800 and 25,200 strikes, which added 17.73 lakh and 17.16 lakh contracts, respectively. The maximum Call unwinding was seen at the 23,700 strike, which shed 68,850 contracts, followed by 23,350 and 23,300 strikes, which shed 8,250 and 3,675 contracts, respectively.
4) Nifty Put Options Data
On the Put side, the 24,000 strike holds the maximum Put open interest was seen (with 43.17 lakh contracts), which can act as a key support level for the Nifty. It was followed by the 23,500 strike (37.42 lakh contracts) and the 24,200 strike (31.31 lakh contracts).
The maximum Put writing was placed at the 23,500 strike, which saw an addition of 17.74 lakh contracts, followed by the 24,000 and 24,200 strikes, which added 14.5 lakh and 11.54 lakh contracts, respectively. The maximum Put unwinding was seen at the 23,750 strike, which shed 1.05 lakh contracts, followed by the 23,450 and 24,600 strikes, which shed 12,525 and 12,450 contracts, respectively.
5) Bank Nifty Call Options Data
According to the monthly options data, the maximum Call open interest was seen at the 55,500 strike, with 8.7 lakh contracts. This can act as a key resistance level for the index in the short term. It was followed by the 55,000 strike (6.38 lakh contracts) and the 56,000 strike (5.9 lakh contracts).
Maximum Call writing was visible at the 55,500 strike (with the addition of 4.79 lakh contracts), followed by the 57,000 strike (1.3 lakh contracts) and the 56,000 strike (1.15 lakh contracts). There was hardly any Call unwinding seen in the 53,250-57,250 strike band.
6) Bank Nifty Put Options Data
On the Put side, the 54,000 strike holds the maximum Put open interest (with 9.06 lakh contracts), which can act as a key support level for the index. This was followed by the 55,000 strike (7.55 lakh contracts) and the 55,500 strike (7.54 lakh contracts).
The maximum Put writing was observed at the 55,500 strike (which added 3.49 lakh contracts), followed by the 54,000 strike (2.88 lakh contracts) and the 55,000 strike (1.48 lakh contracts). The maximum Put unwinding was seen at the 55,800 strike, which shed 4,740 contracts, followed by the 56,200 strike, which shed 510 contracts.
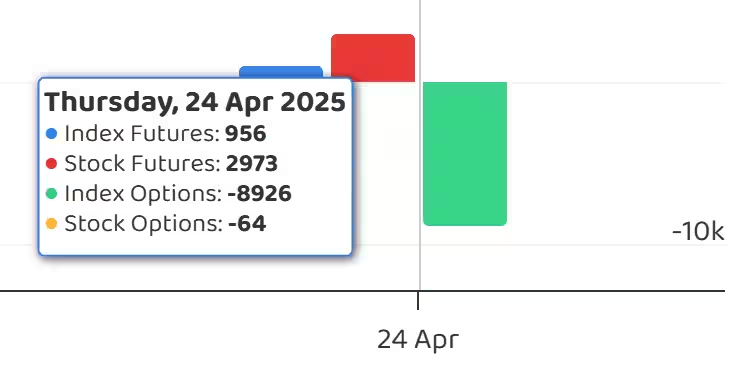
7) Funds Flow (Rs crore)
8) Put-Call Ratio
The Nifty Put-Call ratio (PCR), which indicates the mood of the market, dropped at 1.03 on April 24, from 1.1 in the previous session.
The increasing PCR, or being higher than 0.7 or surpassing 1, means traders are selling more Put options than Call options, which generally indicates the firming up of a bullish sentiment in the market. If the ratio falls below 0.7 or moves towards 0.5, then it indicates selling in Calls is higher than selling in Puts, reflecting a bearish mood in the market.
9) India VIX
The India VIX, which measures expected market volatility, increased further by 1.82 percent, climbing above the 16 mark to 16.25 levels, signaling some caution for the bulls.
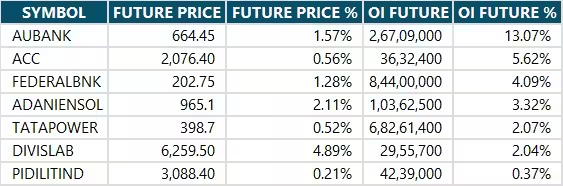
10) Long Build-up (7 Stocks)
A long build-up was seen in 7 stocks. An increase in open interest (OI) and price indicates a build-up of long positions.
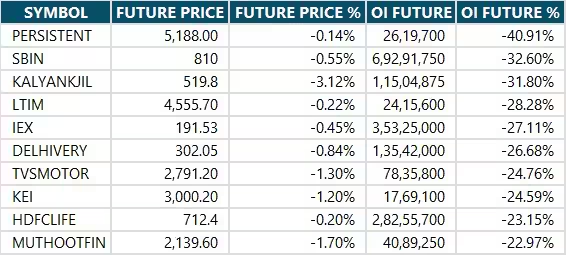
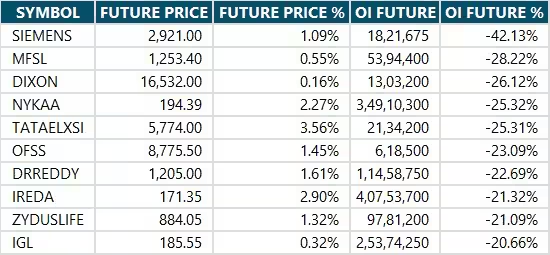
11) Long Unwinding (112 Stocks)
112 stocks saw a decline in open interest (OI) along with a fall in price, indicating long unwinding.
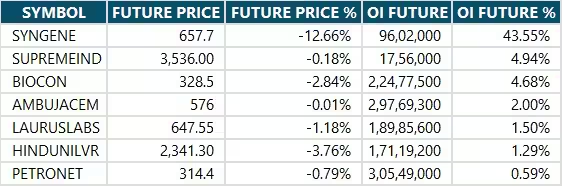
12) Short Build-up (7 Stocks)
7 stocks saw an increase in OI along with a fall in price, indicating a build-up of short positions.
13) Short-Covering (95 Stocks)
95 stocks saw short-covering, meaning a decrease in OI, along with a price increase.
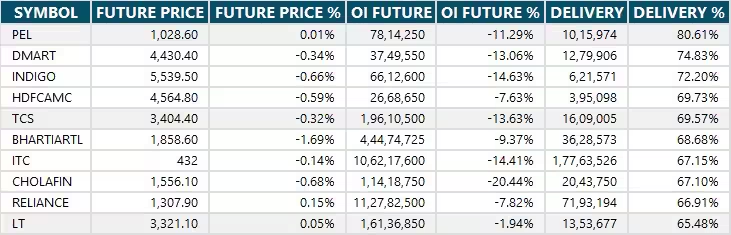
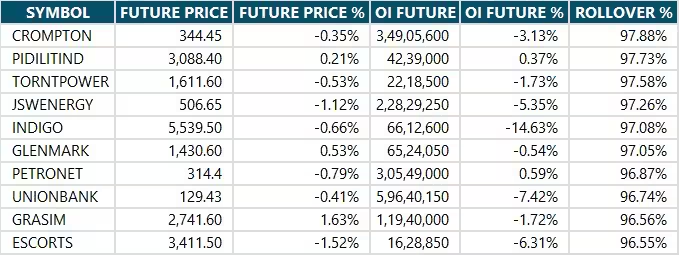
14) High Delivery Trades and High Rollovers
Here are the stocks that saw a high share of delivery trades. A high share of delivery reflects investing (as opposed to trading) interest in a stock.
Here are the stocks that saw the highest rollovers on expiry day.
15) Stocks Under F&O Ban
Securities banned under the F&O segment include companies where derivative contracts cross 95 percent of the market-wide position limit.
Stocks added to F&O ban: Nil
Stocks retained in F&O ban: Nil
Stocks removed from F&O ban: RBL Bank


0 Comment