12 May , 2025 By : Debdeep Gupta

The market corrected by more than 1 percent on Friday as well as during the week ending May 9, tracking rising geopolitical tensions between India and Pakistan. The formation of a long bearish candle on the weekly timeframe, along with a rising volatility index, signals more weakness ahead. However, the Nifty 50 remains within the range of 23,850–24,600 despite Friday’s correction. A decisive breakdown below the lower end of the range could drive the index down to the 23,600–23,500 zone in the upcoming sessions. Conversely, a breakout above 24,600 could resume a new leg of the upmove, according to experts.
Here are 15 data points we have collated to help you spot profitable trades:
1) Key Levels For The Nifty 50 (24,008)
Resistance based on pivot points: 24,123, 24,177, and 24,264
Support based on pivot points: 23,949, 23,895, and 23,808
Special Formation: The Nifty 50 formed a small bullish candle with a long upper shadow on the daily charts, indicating selling pressure at higher levels. Furthermore, the index fell below the 5- and 10-day EMAs but managed to defend the 20-day EMA on a closing basis. It is trading just above the midline of the Bollinger Bands; a decisive breakdown below this level could open the door for further selling pressure. The index is still trading above the March swing high, which acts as immediate support. The Relative Strength Index (RSI) dropped further to 53.88, while the MACD (Moving Average Convergence Divergence) showed a negative crossover, with a weakening histogram.
2) Key Levels For The Bank Nifty (53,595)
Resistance based on pivot points: 53,929, 54,064, and 54,283
Support based on pivot points: 53,493, 53,358, and 53,139
Resistance based on Fibonacci retracement: 54,524, 56,381
Support based on Fibonacci retracement: 52,900, 51,902
Special Formation: The Bank Nifty formed a Doji-like candlestick pattern on the daily charts, indicating indecision between bulls and bears. The index fell 1.42 percent on Friday and is now trading below the short-term moving averages (5-, 10-, and 20-day EMAs) as well as below the midline of the Bollinger Bands, suggesting short-term weakness. The RSI declined to 51.59, and the MACD continued in a negative crossover with a weakening histogram.
3) Nifty Call Options Data
According to the weekly options data, the maximum Call open interest was seen at the 25,000 strike (with 72.53 lakh contracts). This level can act as a key resistance for the Nifty in the short term. It was followed by the 24,500 strike (48.4 lakh contracts), and the 24,000 strike (44.63 lakh contracts).
Maximum Call writing was observed at the 24,000 strike, which saw an addition of 38.38 lakh contracts, followed by the 24,100 and 25,000 strikes, which added 34.47 lakh and 26.38 lakh contracts, respectively. There was hardly any Call unwinding seen in the 23,100-25,050 strike band.
4) Nifty Put Options Data
On the Put side, the 24,000 strike holds the maximum Put open interest (with 67.71 lakh contracts), which can act as a key support level for the Nifty. It was followed by the 23,500 strike (33.77 lakh contracts) and the 23,800 strike (31.57 lakh contracts).
The maximum Put writing was placed at the 24,000 strike, which saw an addition of 28.45 lakh contracts, followed by the 24,100 and 24,050 strikes, which added 16.44 lakh and 11.76 lakh contracts, respectively. The Put unwinding was seen at the 24,300 strike, which shed 13.47 lakh contracts, followed by the 24,200 and 24,400 strikes which shed 6.11 lakh and 6.02 lakh contracts, respectively.
5) Bank Nifty Call Options Data
According to the monthly options data, the maximum Call open interest was seen at the 54,000 strike, with 13.35 lakh contracts. This can act as a key resistance level for the index in the short term. It was followed by the 55,500 strike (10.96 lakh contracts) and the 55,000 strike (10.15 lakh contracts).
Maximum Call writing was visible at the 54,000 strike (with the addition of 4.65 lakh contracts), followed by the 53,700 strike (1.13 lakh contracts) and the 53,800 strike (1.09 lakh contracts). The maximum Call unwinding was seen at the 53,500 strike, which shed 97,500 contracts, followed by the 54,800 and 54,500 strikes, which shed 65,070 and 56,430 contracts, respectively.
6) Bank Nifty Put Options Data
On the Put side, the 54,000 strike holds the maximum Put open interest (with 17.3 lakh contracts), which can act as a key level for the index. This was followed by the 53,000 strike (11.85 lakh contracts) and the 52,000 strike (8.54 lakh contracts).
The maximum Put writing was observed at the 53,500 strike (which added 93,780 contracts), followed by the 53,700 strike (61,140 contracts) and the 53,600 strike (58,200 contracts). The maximum Put unwinding was seen at the 54,500 strike, which shed 1.64 lakh contracts, followed by the 53,000 and 55,000 strikes, which shed 1.39 lakh and 1.1 lakh contracts, respectively.
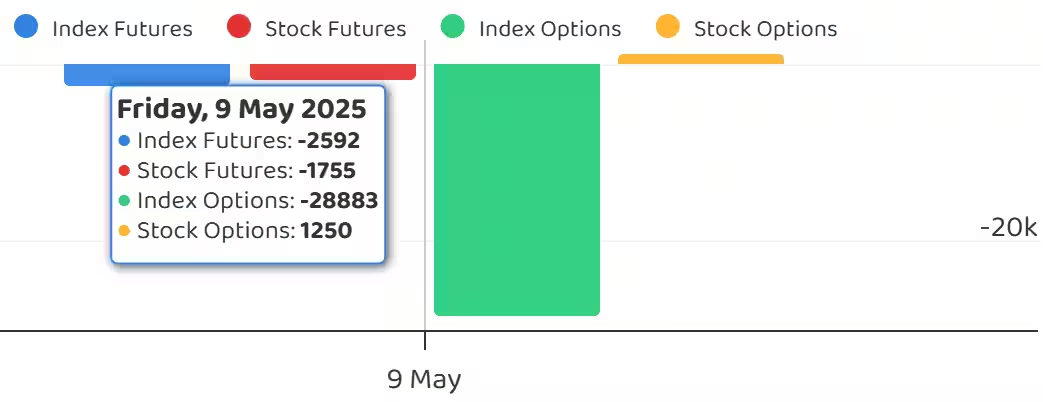
7) Funds Flow (Rs crore)
8) Put-Call Ratio
The Nifty Put-Call ratio (PCR), which indicates the mood of the market, fell to 0.94 on May 9, from 1.08 in the previous session.
The increasing PCR, or being higher than 0.7 or surpassing 1, means traders are selling more Put options than Call options, which generally indicates the firming up of a bullish sentiment in the market. If the ratio falls below 0.7 or moves towards 0.5, then it indicates selling in Calls is higher than selling in Puts, reflecting a bearish mood in the market.
9) India VIX
The India VIX, which measures expected market volatility, jumped to a one-month high amid escalating India-Pakistan tensions, signaling caution for bulls and making the trend more favourable for bears. The index rose by 2.98 percent to 21.63, marking its highest closing level since April 7.
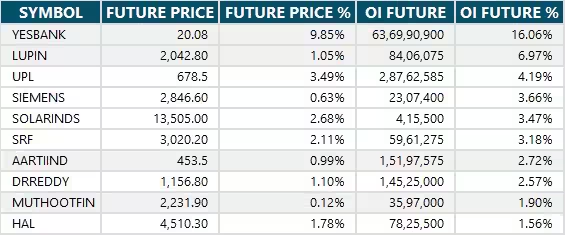
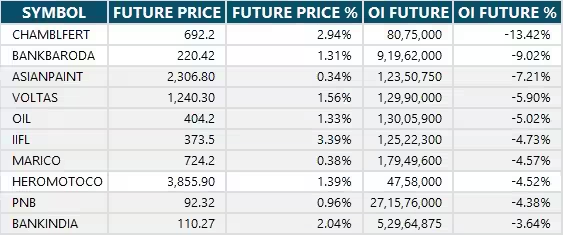
10) Long Build-up (30 Stocks)
A long build-up was seen in 30 stocks. An increase in open interest (OI) and price indicates a build-up of long positions.
11) Long Unwinding (73 Stocks)
73 stocks saw a decline in open interest (OI) along with a fall in price, indicating long unwinding.
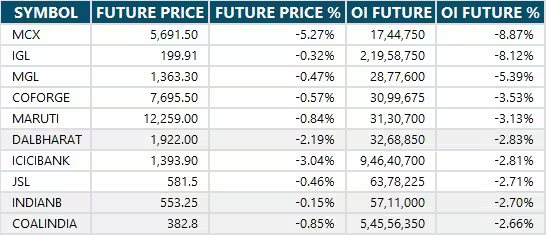
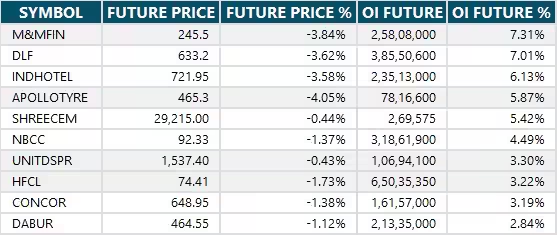
12) Short Build-up (57 Stocks)
57 stocks saw an increase in OI along with a fall in price, indicating a build-up of short positions.
13) Short-Covering (60 Stocks)
60 stocks saw short-covering, meaning a decrease in OI, along with a price increase.
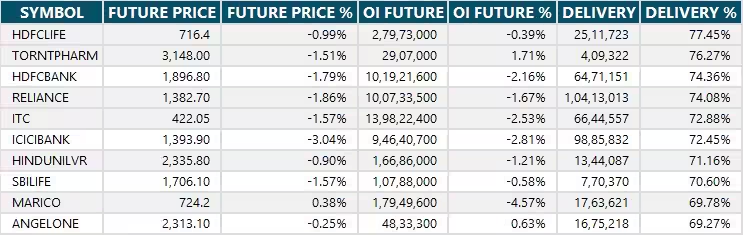
14) High Delivery Trades
Here are the stocks that saw a high share of delivery trades. A high share of delivery reflects investing (as opposed to trading) interest in a stock.
15) Stocks Under F&O Ban
Securities banned under the F&O segment include companies where derivative contracts cross 95 percent of the market-wide position limit.
Stocks added to F&O ban: Nil
Stocks retained in F&O ban: Central Depository Services, Manappuram Finance, RBL Bank
Stocks removed from F&O ban: Nil


0 Comment