28 Jul , 2025 By : Debdeep Gupta

The Nifty 50 decisively broke the previous week's low and its medium-term moving average (50-day EMA) on July 25, falling nearly a percent and extending its correction for another session. Weakening momentum indicators, along with the index slipping below the lower line of the Bollinger Bands, signaled subdued sentiment. According to experts, as long as the index trades below 25,000 (Friday's high), the bears may remain in control. The 24,700 level could act as the next support zone, followed by 24,550. On the higher side, the 25,000–25,150 range may serve as a hurdle zone for the index.
Here are 15 data points we have collated to help you spot profitable trades:
1) Key Levels For The Nifty 50 (24,837)
Resistance based on pivot points: 24,962, 25,011, and 25,089
Support based on pivot points: 24,807, 24,758, and 24,681
Special Formation: The Nifty 50 formed a long bearish candle on the daily timeframe with slightly above-average volumes. The index decisively broke below the 50-day EMA (24,950) and also closed just below the lower line of the Bollinger Bands, indicating weakness. Furthermore, it declined below the upward-sloping support trendline. The Relative Strength Index (RSI) dropped to 40.64 with a bearish crossover, while the Stochastic RSI also gave a negative crossover.
2) Key Levels For The Bank Nifty (56,529)
Resistance based on pivot points: 56,992, 57,165, and 57,444
Support based on pivot points: 56,434, 56,261, and 55,982
Resistance based on Fibonacci retracement: 57,058, 57,583
Support based on Fibonacci retracement: 56,386, 56,090
Special Formation: The Bank Nifty fell nearly 1 percent and formed a long bearish candle on the daily charts, decisively breaking the midline of the Bollinger Bands and the 20-day EMA. The index moved closer to the lower line of the Bollinger Bands. Weakening of the MACD histogram, along with a bearish crossover in RSI (47.88) and Stochastic RSI, signaled a negative trend.
3) Nifty Call Options Data
According to the monthly options data, the 25,000 strike holds the maximum Call open interest (with 1.45 crore contracts). This level can act as a key resistance for the Nifty in the short term. It was followed by the 25,200 strike (1.25 crore contracts), and the 25,500 strike (1.08 crore contracts).
Maximum Call writing was observed at the 25,000 strike, which saw an addition of 95.48 lakh contracts, followed by the 24,900 and 25,200 strikes, which added 58.53 lakh and 44.91 lakh contracts, respectively. There was hardly any Call unwinding seen in the 24,150-25,600 strike band.
4) Nifty Put Options Data
On the Put side, the maximum Put open interest was seen at the 24,500 strike (with 63.38 lakh contracts), which can act as a key support level for the Nifty. It was followed by the 25,000 strike (62.7 lakh contracts) and the 24,700 strike (54.56 lakh contracts).
The maximum Put writing was placed at the 24,700 strike, which saw an addition of 29.51 lakh contracts, followed by the 24,600 and 24,850 strikes, which added 18.26 lakh and 16.08 lakh contracts, respectively. The maximum Put unwinding was seen at the 25,000 strike, which shed 14 lakh contracts, followed by the 25,100 and 25,200 strikes, which shed 8.88 lakh and 8.4 lakh contracts, respectively.
5) Bank Nifty Call Options Data
According to the monthly options data, the maximum Call open interest was seen at the 57,000 strike, with 20.47 lakh contracts. This can act as a key resistance level for the index in the short term. It was followed by the 58,000 strike (15.52 lakh contracts) and the 57,500 strike (14.05 lakh contracts).
Maximum Call writing was visible at the 57,000 strike (with the addition of 4.84 lakh contracts), followed by the 56,500 strike (3.66 lakh contracts), and the 56,800 strike (3.4 lakh contracts). The maximum Call unwinding was seen at the 58,300 strike, which shed 3.14 lakh contracts, followed by the 55,500 and 55,000 strikes, which shed 9,275 and 8,085 contracts, respectively.
6) Bank Nifty Put Options Data
On the Put side, the 56,000 strike holds the maximum Put open interest (with 12.34 lakh contracts), which can act as a key support level for the index. This was followed by the 55,000 strike (10.72 lakh contracts) and the 57,000 strike (10.16 lakh contracts).
The maximum Put writing was observed at the 56,200 strike (which added 1.3 lakh contracts), followed by the 55,400 strike (98,350 contracts) and the 55,700 strike (83,335 contracts). The maximum Put unwinding was seen at the 57,000 strike, which shed 3.32 lakh contracts, followed by the 57,100 and 56,000 strikes, which shed 1.81 lakh and 1.12 lakh contracts, respectively.
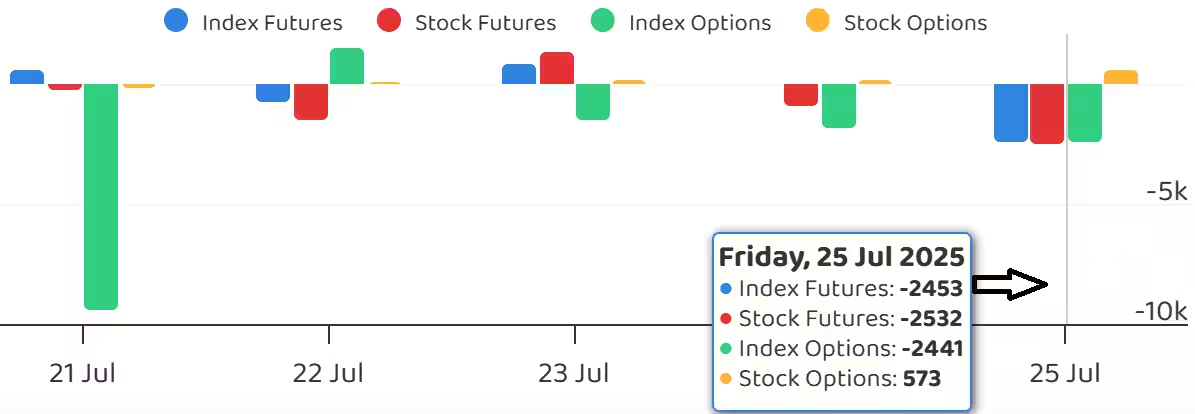
7) Funds Flow (Rs crore)
8) Put-Call Ratio
The Nifty Put-Call ratio (PCR), which indicates the mood of the market, declined further to 0.7 on July 25 (the lowest level since June 3), compared to 0.9 in the previous session.
The increasing PCR, or being higher than 0.7 or surpassing 1, means traders are selling more Put options than Call options, which generally indicates the firming up of a bullish sentiment in the market. If the ratio falls below 0.7 or moves towards 0.5, then it indicates selling in Calls is higher than selling in Puts, reflecting a bearish mood in the market.
9) India VIX
The India VIX, which measures expected market volatility, rose by 5.15 percent to 11.28, extending its upward trajectory for another session on Friday. This uptick in volatility made traders somewhat cautious.
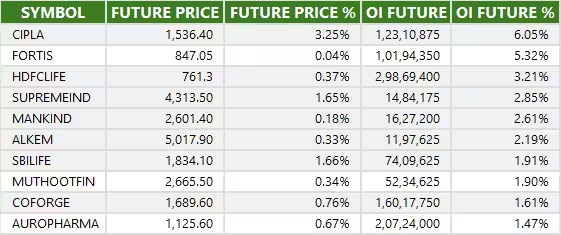
10) Long Build-up (15 Stocks)
A long build-up was seen in 15 stocks. An increase in open interest (OI) and price indicates a build-up of long positions.
11) Long Unwinding (86 Stocks)
86 stocks saw a decline in open interest (OI) along with a fall in price, indicating long unwinding.
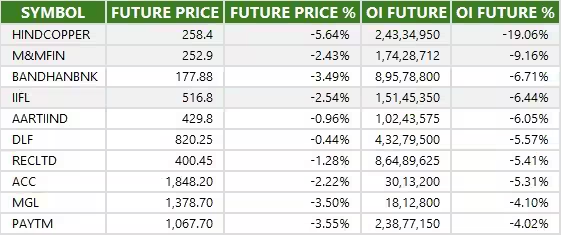
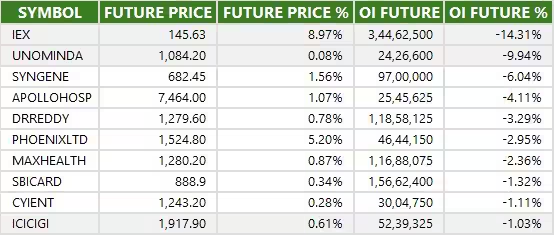
12) Short Build-up (114 Stocks)
114 stocks saw an increase in OI along with a fall in price, indicating a build-up of short positions.
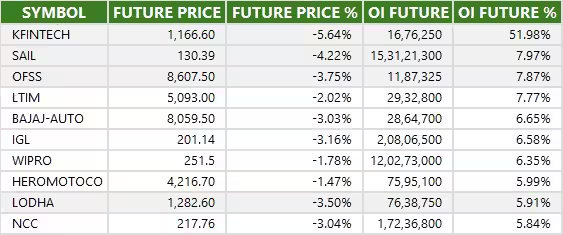
13) Short-Covering (13 Stocks)
13 stocks saw short-covering, meaning a decrease in OI, along with a price increase.
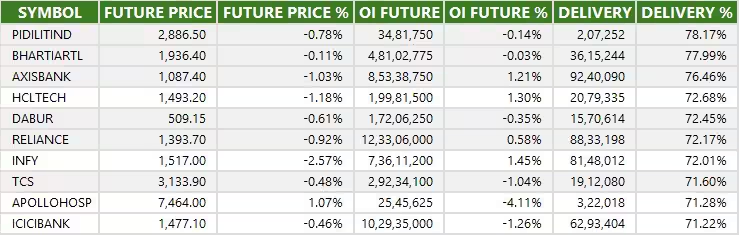
14) High Delivery Trades
Here are the stocks that saw a high share of delivery trades. A high share of delivery reflects investing (as opposed to trading) interest in a stock.
15) Stocks Under F&O Ban
Securities banned under the F&O segment include companies where derivative contracts cross 95 percent of the market-wide position limit.
Stocks added to F&O ban: Nil
Stocks retained in F&O ban: RBL Bank
Stocks removed from F&O ban: Indian Energy Exchange


0 Comment