03 Feb , 2026 By : Debdeep Gupta

The Nifty 50 bounced back sharply on short-covering, rising one percent on February 2 after a day of steep fall. However, follow-up buying interest is needed for bulls to regain control, which now appears possible in the upcoming sessions as the US reduced reciprocal tariffs on Indian goods to 18 percent from 25 percent. Momentum indicators signal a mixed trend, which also needs to align with the upward move. If the index extends the rally, the immediate hurdle is likely to be the 25,160–25,250 zone, followed by the 25,450–25,600 zone, which remains a crucial resistance, as sustaining above it could take the index towards record highs. However, in the case of consolidation, the 25,000–24,800 zone is expected to act as immediate support, experts said.
Here are 15 data points we have collated to help you spot profitable trades:
1) Key Levels For The Nifty 50 (25,088)
Resistance based on pivot points: 25,122, 25,224, and 25,387
Support based on pivot points: 24,795, 24,694, and 24,530
Special Formation: The Nifty 50 formed a long bullish candle with a lower shadow on the daily charts amid the previous day’s long red candle, signalling a positive bias while holding the previous day’s low. The index is still trading below all key moving averages, with the 200-day EMA acting as an immediate resistance, while short- and medium-term moving averages continue to trend downward. The RSI rose to 39.2 and showed a bullish crossover but needs continuation of the uptrend. Meanwhile, the MACD sustained below the signal and zero lines, though weakness in the histogram faded slightly. All these indicators suggest a tentative recovery with limited confirmation so far.
2) Key Levels For The Bank Nifty (58,619)
Resistance based on pivot points: 58,706, 58,908, and 59,236
Support based on pivot points: 58,051, 57,849, and 57,521
Resistance based on Fibonacci retracement: 58,795, 59,107
Support based on Fibonacci retracement: 57,824, 57,013
Special Formation: The Bank Nifty also formed a bullish candle with a long lower shadow on the daily charts, signalling a positive bias with buying interest at lower levels, but it remained within the previous day’s long red candle. The index defended the 100-day EMA and the upward-sloping long-term support trendline on a closing basis. However, it continues to trade below short- and medium-term moving averages, with short-term moving averages trending downward. The RSI inclined upward to 43.34 but remained below the reference line, while the MACD sustained below the signal and zero lines with further weakness in the histogram. All these indicators point to a cautious recovery lacking strong momentum.
3) Nifty Call Options Data
According to the weekly options data, the maximum Call open interest was seen at the 25,500 strike (with 1.65 crore contracts). This level can act as a key resistance level for the Nifty in the short term. It was followed by the 25,400 strike (1.11 crore contracts) and 25,300 strike (99.32 lakh contracts).
Maximum Call writing was observed at the 25,200 strike, which saw an addition of 16.8 lakh contracts, followed by the 25,800 and 25,150 strikes, which added 7.15 lakh and 3.85 lakh contracts, respectively. The maximum Call unwinding was seen at the 25,000 strike which shed 47.99 lakh contracts, followed by the 25,850 and 24,800 strikes, which shed 11.11 lakh and 10.75 lakh contracts, respectively.
4) Nifty Put Options Data
On the Put side, the 24,500 strike holds the maximum Put open interest (with 1.34 crore contracts), which can act as a key support level for the Nifty in the short term. It was followed by the 24,800 strike (1.01 crore contracts) and the 25,000 strike (92.15 lakh contracts).
The maximum Put writing was placed at the 24,800 strike, which saw an addition of 68.72 lakh contracts, followed by the 24,500 and 24,900 strikes, which added 68.41 lakh and 55.19 lakh contracts, respectively. The maximum Put unwinding was seen at the 25,300 strike, which shed 8.93 lakh contracts, followed by the 25,400 and 25,350 strikes, which shed 5.7 lakh and 3.22 lakh contracts, respectively.
5) Bank Nifty Call Options Data
According to the monthly options data, the maximum Call open interest was seen at the 60,000 strike, with 18.87 lakh contracts. This can act as a key resistance level for the index in the short term. It was followed by the 59,000 strike (6.1 lakh contracts) and the 60,500 strike (4.86 lakh contracts).
Maximum Call writing was observed at the 58,500 strike (with the addition of 1.95 lakh contracts), followed by the 58,000 strike (1.61 lakh contracts) and 59,000 strike (1.4 lakh contracts). The maximum Call unwinding was seen at the 59,800 strike, which shed 12,150 contracts, followed by the 60,100 and 59,600 strikes which shed 10,890 and 10,170 contracts, respectively.
6) Bank Nifty Put Options Data
On the Put side, the 60,000 strike holds the maximum Put open interest (with 14.3 lakh contracts), which can act as a key level for the index. This was followed by the 58,000 strike (8.57 lakh contracts) and the 58,500 strike (6.38 lakh contracts).
The maximum Put writing was placed at the 58,000 strike (which added 1.97 lakh contracts), followed by the 58,200 strike (58,560 contracts) and the 58,300 strike (43,830 contracts). The maximum Put unwinding was seen at the 59,000 strike, which shed 52,350 contracts, followed by the 59,500 and 60,000 strikes, which shed 43,410 and 39,060 contracts, respectively.
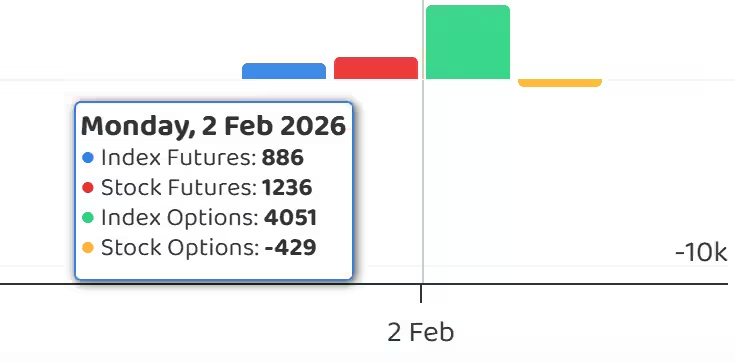
7) Funds Flow (Rs crore)
8) Put-Call Ratio
The Nifty Put-Call ratio (PCR), which indicates the mood of the market, jumped to 0.98 on February 2, compared to 0.59 in the previous session.
The increasing PCR, or being higher than 0.7 or surpassing 1, means traders are selling more Put options than Call options, which generally indicates the firming up of a bullish sentiment in the market. If the ratio falls below 0.7 or moves towards 0.5, then it indicates selling in Calls is higher than selling in Puts, reflecting a bearish mood in the market.
9) India VIX
The India VIX, also known as the fear index, dropped 8.15 percent to 13.86, which supported bulls. However, its ability to sustain above all key moving averages continues to signal caution for bulls.
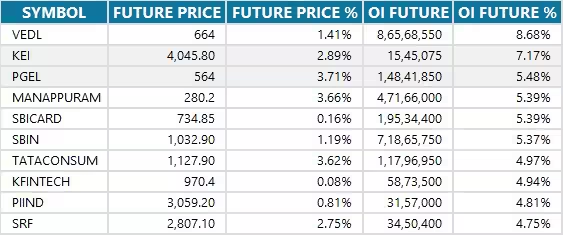
10) Long Build-up (83 Stocks)
A long build-up was seen in 83 stocks. An increase in open interest (OI) and price indicates a build-up of long positions.
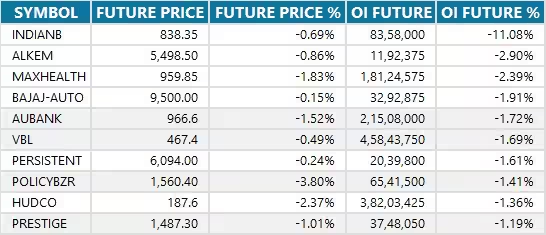
11) Long Unwinding (25 Stocks)
25 stocks saw a decline in open interest (OI) along with a fall in price, indicating long unwinding.
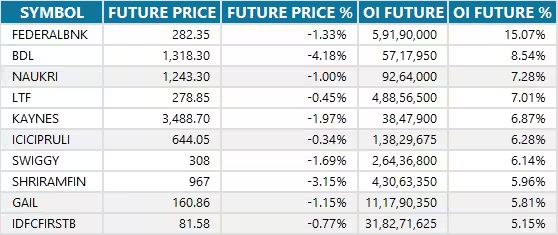
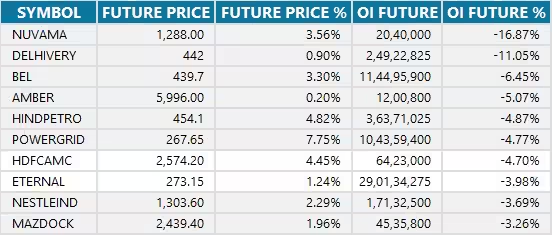
12) Short Build-up (22 Stocks)
22 stocks saw an increase in OI along with a fall in price, indicating a build-up of short positions.
13) Short-Covering (81 Stocks)
81 stocks saw short-covering, meaning a decrease in OI, along with a price increase.
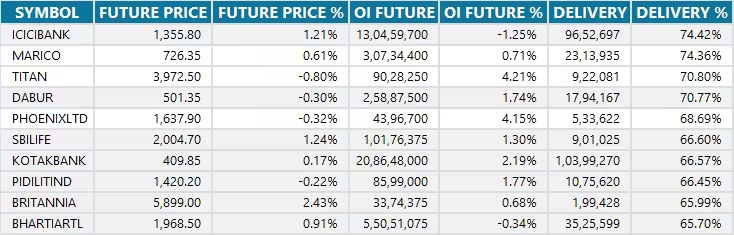
14) High Delivery Trades
Here are the stocks that saw a high share of delivery trades. A high share of delivery reflects investing (as opposed to trading) interest in a stock.
15) Stocks Under F&O Ban
Securities banned under the F&O segment include companies where derivative contracts cross 95 percent of the market-wide position limit.
Stocks added to F&O ban: Nil
Stocks retained in F&O ban: Sammaan Capital
Stocks removed from F&O ban: Nil


0 Comment