15 Jul , 2025 By : Debdeep Gupta

The Nifty 50 continued to witness selling pressure for the fourth consecutive session, falling by 68 points on July 14. Weakness in momentum indicators and the index trading below short-term moving averages signalled a negative trend in the short term. However, the index managed to take support at the psychological level of 25,000 during intraday trade. As long as the index holds this level, an upward move toward 25,100–25,200 remains possible. On the other hand, a breakdown and sustained close below this level may drag the index down to 24,900 (immediate support), followed by 24,800 (crucial support), according to experts.
Here are 15 data points we have collated to help you spot profitable trades:
1) Key Levels For The Nifty 50 (25,082)
Resistance based on pivot points: 25,135, 25,171, and 25,228
Support based on pivot points: 25,021, 24,986, and 24,929
Special Formation: The Nifty 50 formed a bearish candle with a minor lower shadow on the daily chart, indicating continued selling pressure at higher levels, although there was some buying interest at lower levels. It continued to trade below short-term moving averages (10- and 20-day EMAs) and is approaching both the 50-day EMA (24,900) and the upward-sloping support trendline. Momentum indicators remained weak, with the RSI at 46.66, staying below the key 50 mark, and the MACD histogram weakening further.
2) Key Levels For The Bank Nifty (56,765)
Resistance based on pivot points: 56,867, 56,939, and 57,054
Support based on pivot points: 56,637, 56,565, and 56,450
Resistance based on Fibonacci retracement: 57,050, 57,566
Support based on Fibonacci retracement: 56,389, 56,096
Special Formation: The Bank Nifty formed a Doji candlestick pattern on the daily timeframe, indicating indecision among buyers and sellers. The index continued to defend the 56,600 level—the low of the previous couple of weeks—while hovering between the 10- and 20-day EMAs. Notably, it continued to hold above the 20-day EMA, which generally acts as a key support, as well as the trendline that has now turned into support from earlier resistance. Momentum indicators suggested a sideways move, with the RSI at 53.41 appearing flat.
3) Nifty Call Options Data
According to the weekly options data, the maximum Call open interest was seen at the 25,500 strike (with 1.24 crore contracts). This level can act as a key resistance for the Nifty in the short term. It was followed by the 25,300 strike (99.88 lakh contracts), and the 25,400 strike (91.91 lakh contracts).
Maximum Call writing was observed at the 25,100 strike, which saw an addition of 42.81 lakh contracts, followed by the 25,800 and 25,200 strikes, which added 30.84 lakh and 30.29 lakh contracts, respectively. There was hardly any Call unwinding seen in the 24,450-25,900 strike band.
4) Nifty Put Options Data
On the Put side, the 25,000 strike holds the maximum Put open interest (with 86.36 lakh contracts), which can act as a key support level for the Nifty. It was followed by the 24,900 strike (47.86 lakh contracts) and the 25,100 strike (47.84 lakh contracts).
The maximum Put writing was placed at the 24,900 strike, which saw an addition of 23.25 lakh contracts, followed by the 24,600 and 25,050 strikes, which added 19.93 lakh and 19.24 lakh contracts, respectively. The maximum Put unwinding was seen at the 25,300 strike, which shed 9.94 lakh contracts, followed by the 25,200 and 25,150 strikes, which shed 8.86 lakh and 7.82 lakh contracts, respectively.
5) Bank Nifty Call Options Data
According to the monthly options data, the 56,000 strike continues to hold the maximum Call open interest, with 13.83 lakh contracts. This can act as a key level for the index in the short term. It was followed by the 57,000 strike (12.83 lakh contracts) and the 59,000 strike (10.73 lakh contracts).
Maximum Call writing was visible at the 59,000 strike (with the addition of 1.14 lakh contracts), followed by the 58,000 strike (88,725 contracts), and the 56,500 strike (44,415 contracts). The maximum Call unwinding was seen at the 57,300 strike, which shed 18,620 contracts, followed by the 58,800 and 57,100 strikes, which shed 13,965 and 13,090 contracts, respectively.
6) Bank Nifty Put Options Data
On the Put side, the maximum Put open interest remains at the 56,000 strike (with 21.75 lakh contracts), which can act as a key support level for the index. This was followed by the 57,000 strike (11.28 lakh contracts) and the 56,500 strike (6.65 lakh contracts).
The maximum Put writing was observed at the 56,700 strike (which added 38,990 contracts), followed by the 56,800 strike (34,930 contracts) and the 56,600 strike (31,500 contracts). The maximum Put unwinding was seen at the 58,000 strike, which shed 11,585 contracts, followed by the 57,400 and 57,100 strikes, which shed 7,035 and 6,020 contracts, respectively.
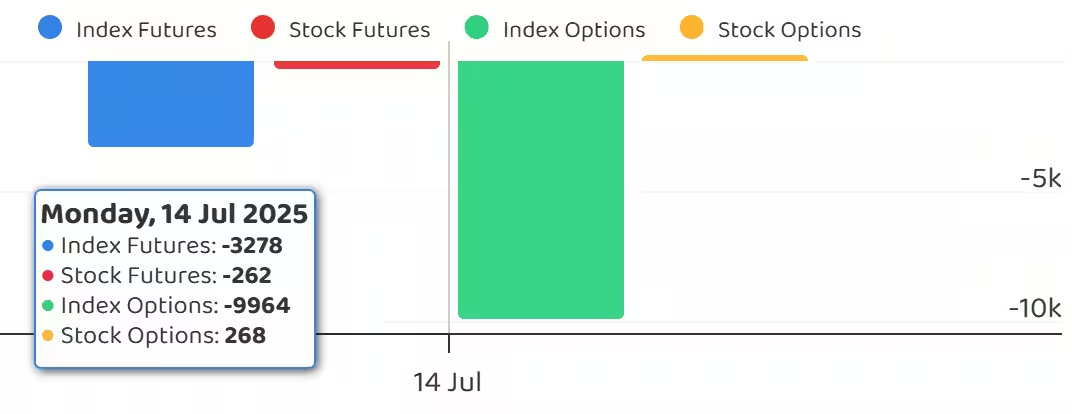
7) Funds Flow (Rs crore)
8) Put-Call Ratio
The Nifty Put-Call ratio (PCR), which indicates the mood of the market, declined further to 0.72 on July 14 (the lowest level since June 3), compared to 0.76 in the previous session.
The increasing PCR, or being higher than 0.7 or surpassing 1, means traders are selling more Put options than Call options, which generally indicates the firming up of a bullish sentiment in the market. If the ratio falls below 0.7 or moves towards 0.5, then it indicates selling in Calls is higher than selling in Puts, reflecting a bearish mood in the market.
9) India VIX
The India VIX, which measures expected market volatility, rose for the second straight session, gaining 1.38 percent to 11.98. However, it continues to remain in the lower zone, indicating some degree of market stability despite the minor consolidation.
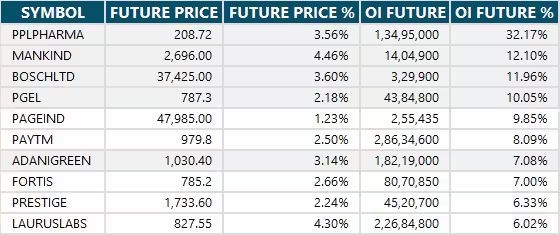
10) Long Build-up (81 Stocks)
A long build-up was seen in 81 stocks. An increase in open interest (OI) and price indicates a build-up of long positions.
11) Long Unwinding (18 Stocks)
18 stocks saw a decline in open interest (OI) along with a fall in price, indicating long unwinding.
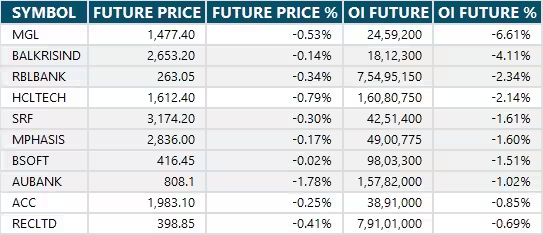
12) Short Build-up (56 Stocks)
56 stocks saw an increase in OI along with a fall in price, indicating a build-up of short positions.
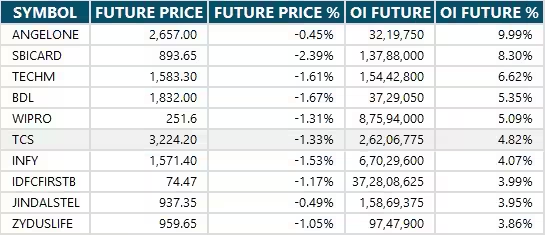
13) Short-Covering (73 Stocks)
73 stocks saw short-covering, meaning a decrease in OI, along with a price increase.
14) High Delivery Trades
Here are the stocks that saw a high share of delivery trades. A high share of delivery reflects investing (as opposed to trading) interest in a stock.
15) Stocks Under F&O Ban
Securities banned under the F&O segment include companies where derivative contracts cross 95 percent of the market-wide position limit.
Stocks added to F&O ban: Nil
Stocks retained in F&O ban: Glenmark Pharma, Hindustan Copper, RBL Bank
Stocks removed from F&O ban: Nil


0 Comment