25 Mar , 2025 By : Debdeep Gupta

The benchmark Nifty 50 jumped more than 1 percent to hit nearly a seven-week high after a gap-up opening on March 24, continuing its northward journey for the sixth consecutive session as bulls remained in strong form with consistent buying interest from FIIs. The index made a good start to the week and is now just 150 points away from its previous swing high of 23,800, which is a crucial zone for further upward movement. If the index decisively surpasses this zone, it can negate the lower highs-lower lows formation and open doors for the 24,000 and 24,200 levels. However, 23,400 (200-day EMA) is expected to act as support, according to experts.
Here are 15 data points we have collated to help you spot profitable trades:
1) Key Levels For The Nifty 50 (23,658)
Resistance based on pivot points: 23,705, 23,770, and 23,876
Support based on pivot points: 23,495, 23,430, and 23,325
Special Formation: With Monday's rally, the Nifty 50 climbed above all key moving averages (10, 20, 50, 100, and 200-day EMAs) and traded above the upper line of the Bollinger Bands, forming a bullish candlestick pattern on the daily charts. The momentum indicators also showed a healthy trend, with the RSI (Relative Strength Index) at 71.49 inching upward, and the MACD (Moving Average Convergence Divergence) remaining above the zero line with a positive bias. All these indicators signaled positivity.
2) Key Levels For The Bank Nifty (51,705)
Resistance based on pivot points: 51,818, 52,055, and 52,439
Support based on pivot points: 51,050, 50,813, and 50,429
Resistance based on Fibonacci retracement: 51,883, 53,020
Support based on Fibonacci retracement: 50,273, 49,283
Special Formation: The Bank Nifty also formed a long bullish candlestick pattern on the daily timeframe with above-average volumes, sustaining its upward journey and forming higher highs and higher lows for the eighth consecutive session. The index decisively surpassed the 50% Fibonacci retracement (54,467 - 47,703) with an expansion of the Bollinger Bands. The momentum indicators also indicated a strong trend, with the RSI at 75 and the MACD well above the zero line.
3) Nifty Call Options Data
According to the monthly options data, the 24,500 strike holds the maximum Call open interest (with 1.02 crore contracts). This level can act as a key resistance for the Nifty in the short term. It was followed by the 24,100 strike (1.01 crore contracts), and the 24,000 strike (99.76 lakh contracts).
Maximum Call writing was observed at the 24,500 strike, which saw an addition of 36.23 lakh contracts, followed by the 24,200 and 24,400 strikes, which added 28.23 lakh and 24.45 lakh contracts, respectively. The maximum Call unwinding was seen at the 23,600 strike, which shed 47.14 lakh contracts, followed by the 23,500 and 23,400 strikes, which shed 34.71 lakh and 31.45 lakh contracts, respectively.
4) Nifty Put Options Data
On the Put side, the maximum Put open interest was seen at the 23,000 strike (with 1.18 crore contracts), which can act as a key support level for the Nifty. It was followed by the 23,300 strike (86.12 lakh contracts) and the 23,500 strike (82.97 lakh contracts).
The maximum Put writing was placed at the 23,500 strike, which saw an addition of 62.54 lakh contracts, followed by the 23,600 and 23,300 strikes, which added 46.63 lakh and 41.15 lakh contracts, respectively. The maximum Put unwinding was seen at the 23,100 strike, which shed 15.81 lakh contracts, followed by the 23,000 and 23,150 strikes, which shed 11.22 lakh and 7.04 lakh contracts, respectively.
5) Bank Nifty Call Options Data
According to the monthly options data, the maximum Call open interest was seen at the 53,000 strike, with 16.39 lakh contracts. This can act as a key resistance level for the index in the short term. It was followed by the 52,000 strike (13.88 lakh contracts) and the 53,500 strike (11.34 lakh contracts).
Maximum Call writing was visible at the 53,500 strike (with the addition of 5.61 lakh contracts), followed by the 51,800 strike (3.45 lakh contracts) and the 53,400 strike (3.33 lakh contracts). The maximum Call unwinding was seen at the 51,000 strike, which shed 6.08 lakh contracts, followed by the 50,500 and 52,000 strikes, which shed 4.45 lakh and 3.87 lakh contracts, respectively.
6) Bank Nifty Put Options Data
On the Put side, the 50,000 strike holds the maximum Put open interest (with 20.64 lakh contracts), which can act as a key support level for the index. This was followed by the 51,000 strike (13.87 lakh contracts) and the 50,500 strike (10.67 lakh contracts).
The maximum Put writing was observed at the 51,000 strike (which added 11.31 lakh contracts), followed by the 51,500 strike (8.67 lakh contracts) and the 50,000 strike (5.26 lakh contracts). The maximum Put unwinding was seen at the 50,100 strike, which shed 1.47 lakh contracts, followed by the 49,900 and 50,200 strikes which shed 99,930 and 73,050 contracts, respectively.
7) Funds Flow (Rs crore)

8) Put-Call Ratio
The Nifty Put-Call ratio (PCR), which indicates the mood of the market, rose to 1.22 on March 24, against 1.15 in the previous session.
The increasing PCR, or being higher than 0.7 or surpassing 1, means traders are selling more Put options than Call options, which generally indicates the firming up of a bullish sentiment in the market. If the ratio falls below 0.7 or moves towards 0.5, then it indicates selling in Calls is higher than selling in Puts, reflecting a bearish mood in the market.
9) India VIX
The India VIX, the fear factor, spiked 8.95 percent in a single session to 13.7, signaling a bit of caution for bulls as it is above short-term moving averages (10 and 20-day EMAs), though it is still under the 14 mark.
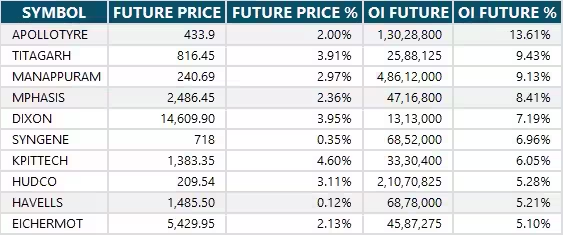
10) Long Build-up (71 Stocks)
A long build-up was seen in 71 stocks. An increase in open interest (OI) and price indicates a build-up of long positions.
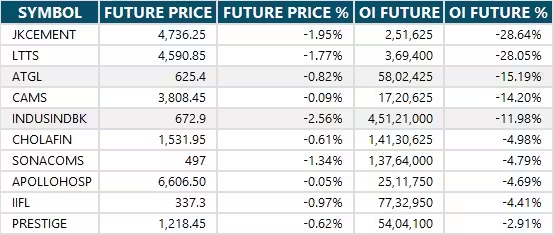
11) Long Unwinding (21 Stocks)
21 stocks saw a decline in open interest (OI) along with a fall in price, indicating long unwinding.
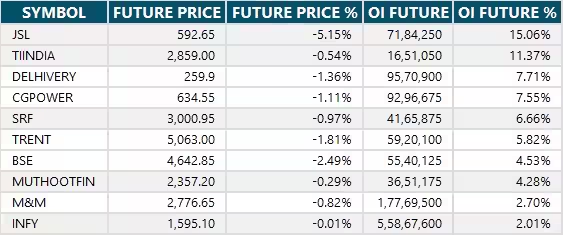
12) Short Build-up (21 Stocks)
21 stocks saw an increase in OI along with a fall in price, indicating a build-up of short positions.
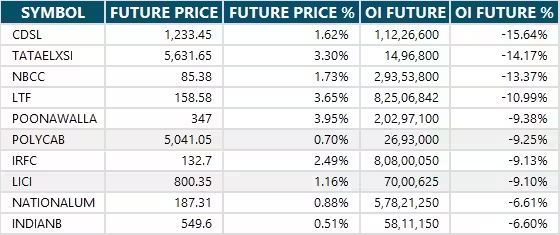
13) Short-Covering (108 Stocks)
108 stocks saw short-covering, meaning a decrease in OI, along with a price increase.
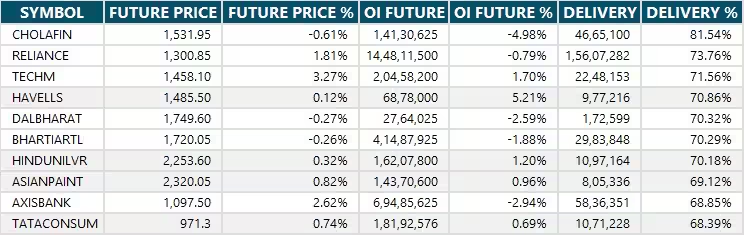
14) High Delivery Trades
Here are the stocks that saw a high share of delivery trades. A high share of delivery reflects investing (as opposed to trading) interest in a stock.
15) Stocks Under F&O Ban
Securities banned under the F&O segment include companies where derivative contracts cross 95 percent of the market-wide position limit.
Stocks added to F&O ban: Nil
Stocks retained in F&O ban: IndusInd Bank
Stocks removed from F&O ban: Hindustan Copper, Polycab India


0 Comment