03 Jun , 2025 By : Debdeep Gupta

The Nifty 50 corrected 174 points and fell below the midline of the Bollinger Bands as well as the 20-day EMA on June 3, but it continued to trade within the 24,500–25,000 range, which has been intact since mid-May. Momentum indicators reflected a negative trend. If the index breaks below the lower boundary of this range, the 24,380 level will be crucial, as a decisive fall below this point could trigger increased bearish activity. However, if the index continues to defend the lower range, immediate resistance is expected at 24,700, followed by 24,900, according to experts.
Here are 15 data points we have collated to help you spot profitable trades:
1) Key Levels For The Nifty 50 (24,543)
Resistance based on pivot points: 24,761, 24,842, and 24,973
Support based on pivot points: 24,499, 24,418, and 24,287
Special Formation: The Nifty 50 formed a long bearish candle on the daily charts, almost engulfing the previous session’s Bullish Hammer-like candle. The index fell below both the midline of the Bollinger Bands and the short-term moving average (20-day EMA). The MACD maintained its negative crossover with a weakening histogram, while the RSI at 50.64 also signaled a negative crossover—altogether indicating a bearish sentiment.
2) Key Levels For The Bank Nifty (55,600)
Resistance based on pivot points: 56,009, 56,175, and 56,445
Support based on pivot points: 55,469, 55,303, and 55,033
Resistance based on Fibonacci retracement: 56,307, 58,648
Support based on Fibonacci retracement: 54,117, 52,892
Special Formation: The Bank Nifty hit a fresh intraday record high but failed to sustain those gains. It declined 303 points due to profit booking and formed a bearish candlestick pattern on the daily timeframe, accompanied by above-average volumes. Despite the decline, the index continued to trade well above the midline of the Bollinger Bands and all key moving averages. The RSI tilted downward but still held above the 50 mark at 58.92. The MACD also sustained its negative crossover with a weakening histogram, although it remained well above the zero line—suggesting the broader trend remains intact despite short-term weakness.
3) Nifty Call Options Data
According to the weekly options data, the 25,500 strike holds the maximum Call open interest (with 1.61 crore contracts). This level can act as a key resistance for the Nifty in the short term. It was followed by the 25,000 strike (1.32 crore contracts), and the 24,800 strike (1 crore contracts).
Maximum Call writing was observed at the 25,500 strike, which saw an addition of 68.61 lakh contracts, followed by the 24,600 and 25,000 strikes, which added 53.72 lakh and 45.91 lakh contracts, respectively. The maximum Call unwinding was seen at the 24,000 strike, which shed 13,125 contracts, followed by the 24,200 and 24,100 strikes which shed 9,225 and 5,700 contracts, respectively.
4) Nifty Put Options Data
On the Put side, the maximum Put open interest was seen at the 24,000 strike (with 76.06 lakh contracts), which can act as a key support level for the Nifty. It was followed by the 24,600 strike (56.51 lakh contracts) and the 24,500 strike (54.29 lakh contracts).
The maximum Put writing was placed at the 24,300 strike, which saw an addition of 12.25 lakh contracts, followed by the 24,550 and 24,400 strikes, which added 8.51 lakh and 3.57 lakh contracts, respectively. The Put unwinding was seen at the 24,100 strike, which shed 14.32 lakh contracts, followed by the 24,500 and 24,800 strikes which shed 13.33 lakh and 7.89 lakh contracts, respectively.
5) Bank Nifty Call Options Data
According to the monthly options data, the 56,000 strike holds the maximum Call open interest, with 22.17 lakh contracts. This can act as a key resistance level for the index in the short term. It was followed by the 57,000 strike (9.25 lakh contracts) and the 55,000 strike (5.99 lakh contracts).
Maximum Call writing was visible at the 56,000 strike (with the addition of 1.95 lakh contracts), followed by the 57,000 strike (1.18 lakh contracts), and the 56,500 strike (72,720 contracts). The maximum Call unwinding was seen at the 55,000 strike, which shed 25,470 contracts, followed by the 57,200 and 54,000 strikes, which shed 9,480 and 6,060 contracts, respectively.
6) Bank Nifty Put Options Data
On the Put side, the maximum Put open interest was seen at the 56,000 strike (with 16.37 lakh contracts), which can act as a key level for the index. This was followed by the 55,000 strike (10.24 lakh contracts) and the 54,000 strike (7.74 lakh contracts).
The maximum Put writing was observed at the 56,500 strike (which added 11,850 contracts), followed by the 54,500 strike (14,550 contracts) and the 56,300 strike (8,940 contracts). The maximum Put unwinding was seen at the 55,500 strike, which shed 1.07 lakh contracts, followed by the 54,000 and 55,600 strikes, which shed 64,380 and 55,440 contracts, respectively.
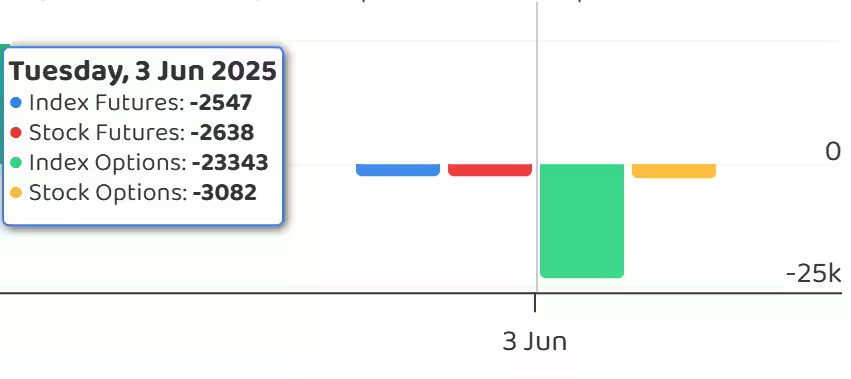
7) Funds Flow (Rs crore)
8) Put-Call Ratio
The Nifty Put-Call ratio (PCR), which indicates the mood of the market, drops to 0.65 on June 3, from 0.82 in the previous session.
The increasing PCR, or being higher than 0.7 or surpassing 1, means traders are selling more Put options than Call options, which generally indicates the firming up of a bullish sentiment in the market. If the ratio falls below 0.7 or moves towards 0.5, then it indicates selling in Calls is higher than selling in Puts, reflecting a bearish mood in the market.
9) India VIX
India VIX, the fear gauge, declined by 3.51 percent to 16.56 levels after a sharp rally but remains in the elevated zone. Hence, bulls are advised to stay cautious.
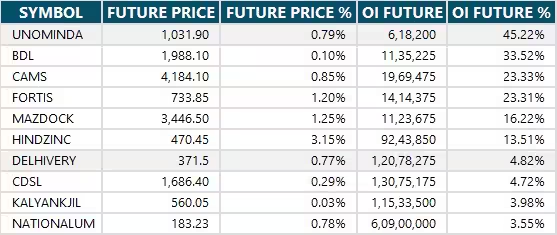
10) Long Build-up (31 Stocks)
A long build-up was seen in 31 stocks. An increase in open interest (OI) and price indicates a build-up of long positions.
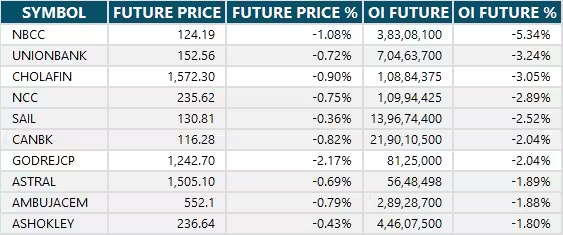
11) Long Unwinding (51 Stocks)
51 stocks saw a decline in open interest (OI) along with a fall in price, indicating long unwinding.
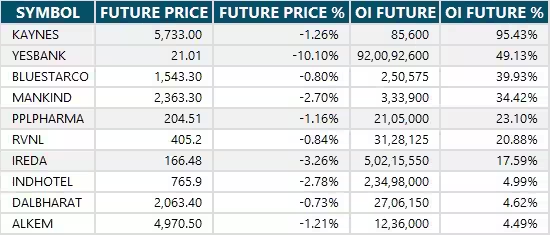
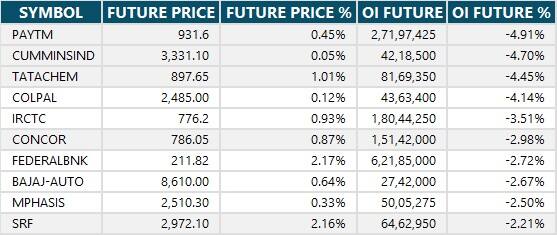
12) Short Build-up (109 Stocks)
109 stocks saw an increase in OI along with a fall in price, indicating a build-up of short positions.
13) Short-Covering (33 Stocks)
33 stocks saw short-covering, meaning a decrease in OI, along with a price increase.
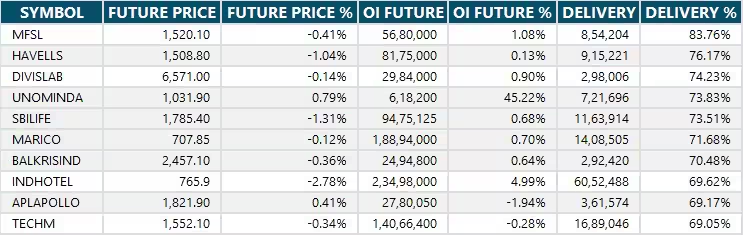
14) High Delivery Trades
Here are the stocks that saw a high share of delivery trades. A high share of delivery reflects investing (as opposed to trading) interest in a stock.
15) Stocks Under F&O Ban
Securities banned under the F&O segment include companies where derivative contracts cross 95 percent of the market-wide position limit.
Stocks added to F&O ban: Nil
Stocks retained in F&O ban: Manappuram Finance
Stocks removed from F&O ban: Nil


0 Comment