02 May , 2025 By : Debdeep Gupta

The market had another rangebound session on April 30, the weekly F&O expiry day, closing flat amid elevated volatility. This suggests that the market may be waiting for a trigger to move decisively in either direction. However, technical indicators still reflect a healthy trend. The rising volatility, amidst increasing geopolitical tensions between India and Pakistan, also signals a need for caution. Hence, the index is likely to remain in the range of 24,000–24,500 in the upcoming sessions. A decisive move above 24,500 could open the doors for a rally towards 24,800, while a breakdown below 24,000 may drag the index down to the 23,850 level, according to experts.
Here are 15 data points we have collated to help you spot profitable trades:
1) Key Levels For The Nifty 50 (24,334)
Resistance based on pivot points: 24,385, 24,432, and 24,507
Support based on pivot points: 24,234, 24,188, and 24,112
Special Formation: The Nifty 50 formed a Doji-like candlestick pattern during the weekly F&O expiry session, indicating indecision between bulls and bears. However, the overall trend remains positive, given that the index traded well above all key moving averages (10, 20, 50, 100, and 200-day EMAs), with all these EMAs trending upward. Additionally, the Bollinger Bands are expanding, further confirming momentum. The Relative Strength Index (RSI) plateaued at 65, while the Moving Average Convergence Divergence (MACD) continues to trend upward and remains well above the zero line.
2) Key Levels For The Bank Nifty (55,087)
Resistance based on pivot points: 55,385, 55,563, and 55,851
Support based on pivot points: 54,808, 54,630, and 54,342
Resistance based on Fibonacci retracement: 56,307, 58,648
Support based on Fibonacci retracement: 54,117, 52,891
Special Formation: The Bank Nifty remained under pressure, falling 0.55 percent and forming a bearish candlestick pattern with a lower shadow on the daily chart—suggesting some buying interest at lower levels. Overall, it remained rangebound. The index continued to trade well above all key moving averages, with the EMAs trending upward. However, the RSI, at 67.02, is on the verge of a negative crossover.
3) Nifty Call Options Data
According to the weekly options data, the maximum Call open interest was seen at the 25,000 strike (with 47.58 lakh contracts). This level can act as a key resistance for the Nifty in the short term. It was followed by the 25,200 strike (33.11 lakh contracts), and the 24,800 strike (30.51 lakh contracts).
Maximum Call writing was observed at the 25,200 strike, which saw an addition of 18.28 lakh contracts, followed by the 24,800 and 25,000 strikes, which added 16.4 lakh and 14.6 lakh contracts, respectively. There was hardly any Call unwinding seen in the 23,400-25,400 strike band.
4) Nifty Put Options Data
On the Put side, the 24000 strike holds the maximum Put open interest (with 45.42 lakh contracts), which can act as a key support level for the Nifty. It was followed by the 23,500 strike (34.06 lakh contracts) and the 24,300 strike (29.78 lakh contracts).
The maximum Put writing was placed at the 24,000 strike, which saw an addition of 17.53 lakh contracts, followed by the 23,500 and 24,300 strikes, which added 16.78 lakh and 16.38 lakh contracts, respectively. There was hardly any Put unwinding seen in the 23,400-25,400 strike band.
5) Bank Nifty Call Options Data
According to the monthly options data, the maximum Call open interest was seen at the 55,500 strike, with 10.53 lakh contracts. This can act as a key resistance level for the index in the short term. It was followed by the 57,000 strike (8.62 lakh contracts) and the 56,000 strike (8.06 lakh contracts).
Maximum Call writing was visible at the 55,200 strike (with the addition of 58,140 contracts), followed by the 57,000 strike (53,430 contracts) and the 55,300 strike (43,830 contracts). The maximum Call unwinding was seen at the 55,700 strike, which shed 58,890 contracts, followed by the 55,600 and 55,500 strikes, which shed 53,730 and 35,880 contracts, respectively.
6) Bank Nifty Put Options Data
On the Put side, the 54,000 strike holds the maximum Put open interest (with 11.13 lakh contracts), which can act as a key support level for the index. This was followed by the 55,000 strike (9.17 lakh contracts) and the 55,500 strike (8.63 lakh contracts).
The maximum Put writing was observed at the 55,400 strike (which added 37,650 contracts), followed by the 53,700 strike (23,880 contracts) and the 55,300 strike (19,710 contracts). The maximum Put unwinding was seen at the 54,000 strike, which shed 56,460 contracts, followed by the 55,600 and 54,200 strikes, which shed 36,360 and 22,800 contracts, respectively.
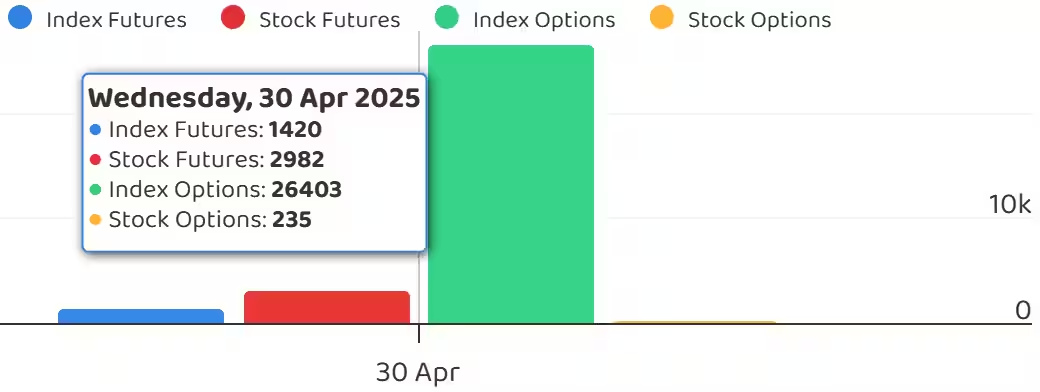
7) Funds Flow (Rs crore)
8) Put-Call Ratio
The Nifty Put-Call ratio (PCR), which indicates the mood of the market, jumped to 1.16 on April 30, from 0.94 in the previous session.
The increasing PCR, or being higher than 0.7 or surpassing 1, means traders are selling more Put options than Call options, which generally indicates the firming up of a bullish sentiment in the market. If the ratio falls below 0.7 or moves towards 0.5, then it indicates selling in Calls is higher than selling in Puts, reflecting a bearish mood in the market.
9) India VIX
The India VIX, which measures expected market volatility, climbed further to 18.22 levels—rising by 4.91 percent—and is trading above all key moving averages, signaling increased caution for bulls.
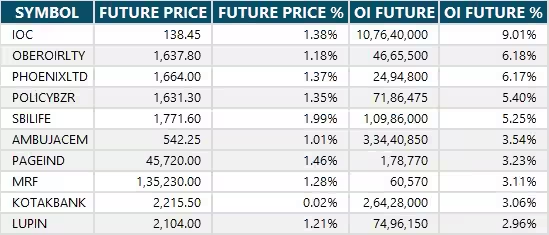
10) Long Build-up (34 Stocks)
A long build-up was seen in 34 stocks. An increase in open interest (OI) and price indicates a build-up of long positions.
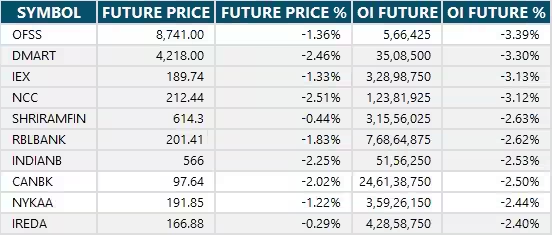
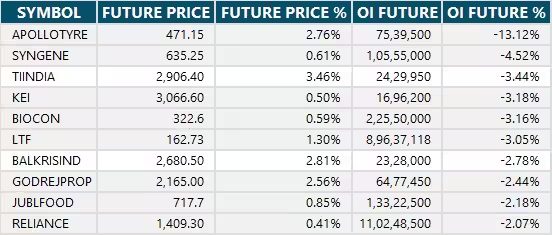
11) Long Unwinding (59 Stocks)
59 stocks saw a decline in open interest (OI) along with a fall in price, indicating long unwinding.
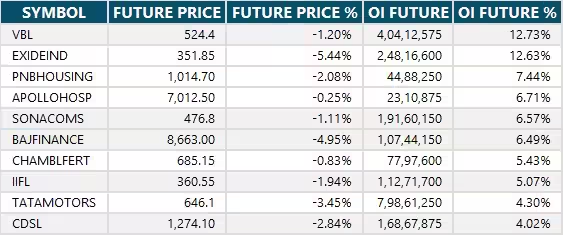
12) Short Build-up (95 Stocks)
95 stocks saw an increase in OI along with a fall in price, indicating a build-up of short positions.
13) Short-Covering (32 Stocks)
32 stocks saw short-covering, meaning a decrease in OI, along with a price increase.
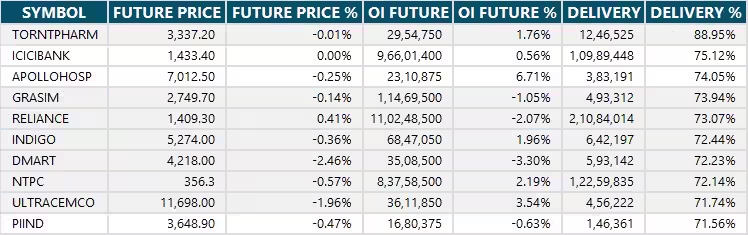
14) High Delivery Trades
Here are the stocks that saw a high share of delivery trades. A high share of delivery reflects investing (as opposed to trading) interest in a stock.
15) Stocks Under F&O Ban
Securities banned under the F&O segment include companies where derivative contracts cross 95 percent of the market-wide position limit.
Stocks added to F&O ban: Nil
Stocks retained in F&O ban: RBL Bank
Stocks removed from F&O ban: Nil


0 Comment