04 Aug , 2025 By : Debdeep Gupta

The Nifty 50 fell below its 100-day EMA on August 1, declining by 0.8 percent, marking a negative start to the August series. Momentum indicators signaled a bearish trend with a continued formation of lower highs and lower lows. According to experts, if the index breaks and sustains below the 24,500 support level, the selling pressure may drag it down to the 24,200–24,000 zone. However, in case of a rebound, the 24,700–24,800 levels are key to watch. As long as the index trades below 25,000, consolidation may continue.
Here are 15 data points we have collated to help you spot profitable trades:
1) Key Levels For The Nifty 50 (24,565)
Resistance based on pivot points: 24,723, 24,782, and 24,877
Support based on pivot points: 24,533, 24,474, and 24,379
Special Formation: The Nifty 50 formed a bearish candle on the daily chart, falling below the 100-day EMA on August 1. The index is already trading below the 20-day and 50-day EMAs, all of which indicate a negative sentiment. Momentum indicators such as the RSI stood at 36.01, trending downward, while the MACD remained below the zero line with a weakening histogram — both suggesting that bears have the upper hand.
2) Key Levels For The Bank Nifty (55,618)
Resistance based on pivot points: 55,964, 56,090, and 56,295
Support based on pivot points: 55,554, 55,428, and 55,224
Resistance based on Fibonacci retracement: 56,355, 56,600
Support based on Fibonacci retracement: 55,150, 54,471
Special Formation: The Bank Nifty also formed a bearish candle on the daily timeframe, falling 0.6 percent and extending its downtrend for the third consecutive session. The index traded below both the 20-day and 50-day EMAs. The MACD remained below the zero line with continued weakness in the histogram. The RSI dropped below the 40 mark to 38.4, accompanied by a consistent bearish crossover in the Stochastic RSI. This further supports the bearish outlook.
3) Nifty Call Options Data
According to the weekly options data, the maximum Call open interest was seen at the 25,000 strike (with 1.09 crore contracts). This level can act as a key resistance for the Nifty in the short term. It was followed by the 24,800 strike (94.56 lakh contracts), and the 24,700 strike (74.89 lakh contracts).
Maximum Call writing was observed at the 24,800 strike, which saw an addition of 65.22 lakh contracts, followed by the 24,700 and 25,000 strikes, which added 61.75 lakh and 59.4 lakh contracts, respectively. There was hardly any Call unwinding seen in the 23,750-25,500 strike band.
4) Nifty Put Options Data
On the Put side, the 24,200 strike holds the maximum Put open interest (with 62.55 lakh contracts), which can act as a key support level for the Nifty. It was followed by the 24,000 strike (56.08 lakh contracts) and the 24,500 strike (43.52 lakh contracts).
The maximum Put writing was placed at the 24,200 strike, which saw an addition of 36.62 lakh contracts, followed by the 24,000 and 24,300 strikes, which added 10.06 lakh and 9.91 lakh contracts, respectively. The maximum Put unwinding was seen at the 24,800 strike, which shed 6.32 lakh contracts, followed by the 24,850 and 24,900 strikes, which shed 4.8 lakh and 4.45 lakh contracts, respectively.
5) Bank Nifty Call Options Data
According to the monthly options data, the 57,000 strike holds the maximum Call open interest, with 20.87 lakh contracts. This can act as a key resistance level for the index in the short term. It was followed by the 56,000 strike (9.05 lakh contracts) and the 56,500 strike (5.32 lakh contracts).
Maximum Call writing was visible at the 56,000 strike (with the addition of 3.68 lakh contracts), followed by the 57,000 strike (2.27 lakh contracts), and the 55,800 strike (1.21 lakh contracts). There was hardly any Call unwinding seen in the 53,750-57,750 strike band.
6) Bank Nifty Put Options Data
On the Put side, the maximum Put open interest was placed at the 57,000 strike (with 14.18 lakh contracts), which can act as a key level for the index. This was followed by the 56,000 strike (9.39 lakh contracts) and the 55,000 strike (8.15 lakh contracts).
The maximum Put writing was observed at the 54,000 strike (which added 2.14 lakh contracts), followed by the 56,000 strike (1.98 lakh contracts) and the 55,800 strike (1.08 lakh contracts). The maximum Put unwinding was seen at the 56,500 strike, which shed 30,800 contracts, followed by the 57,000 and 56,700 strikes, which shed 11,585 and 3,500 contracts, respectively.
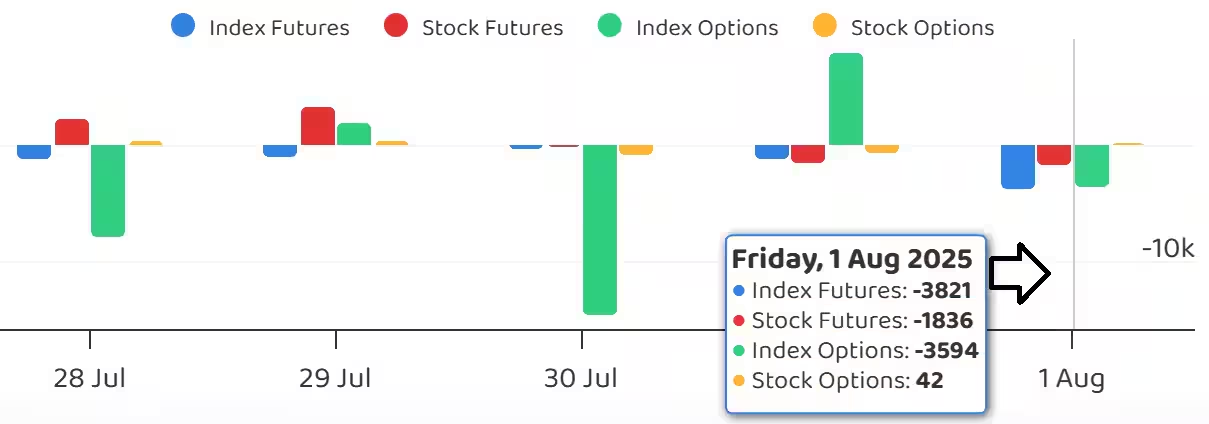
7) Funds Flow (Rs crore)
8) Put-Call Ratio
The Nifty Put-Call ratio (PCR), which indicates the mood of the market, dropped to 0.75 on August 1, compared to 1.04 in the previous session.
The increasing PCR, or being higher than 0.7 or surpassing 1, means traders are selling more Put options than Call options, which generally indicates the firming up of a bullish sentiment in the market. If the ratio falls below 0.7 or moves towards 0.5, then it indicates selling in Calls is higher than selling in Puts, reflecting a bearish mood in the market.
9) India VIX
The India VIX, also known as the fear index, extended its upward journey for the second straight session, rising 3.75 percent to 11.98. It climbed above its short-term moving averages, signaling some caution for the bulls.
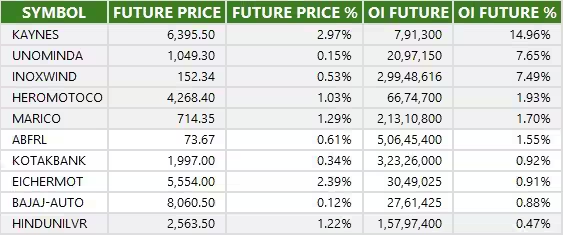
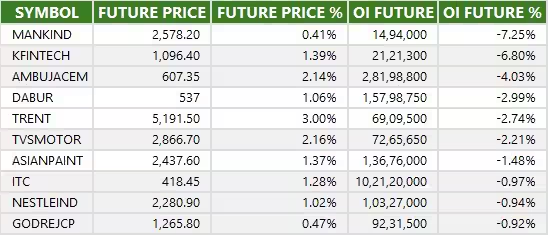
10) Long Build-up (13 Stocks)
A long build-up was seen in 13 stocks. An increase in open interest (OI) and price indicates a build-up of long positions.
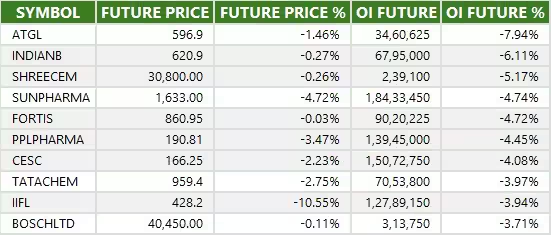
11) Long Unwinding (75 Stocks)
75 stocks saw a decline in open interest (OI) along with a fall in price, indicating long unwinding.
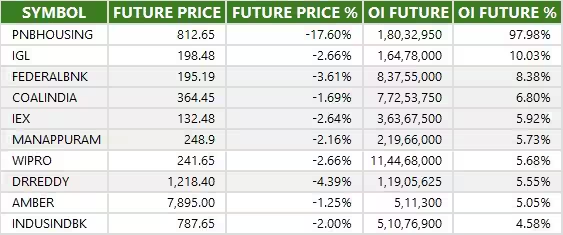
12) Short Build-up (118 Stocks)
118 stocks saw an increase in OI along with a fall in price, indicating a build-up of short positions.
13) Short-Covering (12 Stocks)
12 stocks saw short-covering, meaning a decrease in OI, along with a price increase.
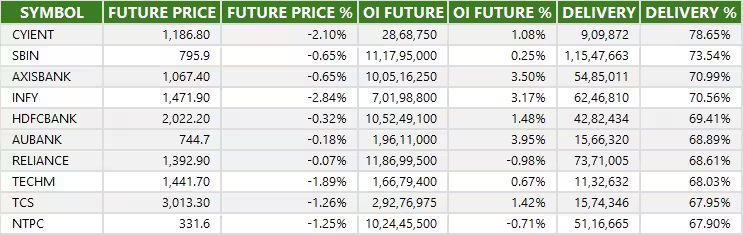
14) High Delivery Trades
Here are the stocks that saw a high share of delivery trades. A high share of delivery reflects investing (as opposed to trading) interest in a stock.
15) Stocks Under F&O Ban
Securities banned under the F&O segment include companies where derivative contracts cross 95 percent of the market-wide position limit.
Stocks added to F&O ban: PNB Housing Finance
Stocks retained in F&O ban: Nil
Stocks removed from F&O ban: Nil


0 Comment