16 Jul , 2025 By : Debdeep Gupta

The Nifty 50 bounced back and snapped a four-day losing streak on July 15, rising 114 points with healthy market breadth. Buying strength was observed throughout the session; however, until the index sustains above its short-term moving averages, consolidation and rangebound trading may continue. According to experts, if the index reclaims and holds the 25,250–25,300 zone (corresponding to the 20-day and 10-day EMAs), an upward move toward 25,400–25,500 is possible. On the downside, 25,000 is expected to act as a key support zone.
Here are 15 data points we have collated to help you spot profitable trades:
1) Key Levels For The Nifty 50 (25,196)
Resistance based on pivot points: 25,236, 25,273, and 25,333
Support based on pivot points: 25,117, 25,080, and 25,020
Special Formation: The Nifty 50 formed a bullish candle with a minor upper shadow on the daily timeframe, indicating buying interest emerging from the 25,000 support zone. The index also displayed a higher high–higher low pattern, although it continued to trade below short-term moving averages. The Relative Strength Index (RSI) climbed above the 50 mark and is trending upward, indicating improving momentum. However, the Moving Average Convergence Divergence (MACD) remains in a negative crossover, with the histogram showing further weakness.
2) Key Levels For The Bank Nifty (57,007)
Resistance based on pivot points: 57,113, 57,214, and 57,377
Support based on pivot points: 56,787, 56,686, and 56,523
Resistance based on Fibonacci retracement: 57,566, 58,224
Support based on Fibonacci retracement: 56,389, 56,096
Special Formation: The Bank Nifty formed a bullish candle with a minor upper wick on the daily chart, signaling continuation of the upside bounce from the 56,600 support level. The index also climbed above its short-term moving averages. The Stochastic RSI is on the verge of a positive crossover in the oversold zone, while the RSI hovered around the 60 level and is trending upward. The MACD continues to show a negative crossover, though there is some improvement seen in the histogram, indicating potential easing of bearish momentum.
3) Nifty Call Options Data
According to the weekly options data, the 26,000 strike holds the maximum Call open interest (with 1.24 crore contracts). This level can act as a key resistance for the Nifty in the short term. It was followed by the 25,500 strike (1.18 crore contracts), and the 25,200 strike (97.36 lakh contracts).
Maximum Call writing was observed at the 26,000 strike, which saw an addition of 13.92 lakh contracts, followed by the 25,200 and 25,250 strikes, which added 8.72 lakh and 7.66 lakh contracts, respectively. The maximum Call unwinding was seen at the 25,100 strike, which shed 27.93 lakh contracts, followed by the 25,800 and 25,300 strikes, which shed 23.6 lakh and 14.23 lakh contracts, respectively.
4) Nifty Put Options Data
On the Put side, the maximum Put open interest was seen at the 25,000 strike (with 1.05 crore contracts), which can act as a key support level for the Nifty. It was followed by the 25,200 strike (89.82 lakh contracts) and the 25,100 strike (84.89 lakh contracts).
The maximum Put writing was placed at the 25,200 strike, which saw an addition of 57.96 lakh contracts, followed by the 25,100 and 25,150 strikes, which added 37.04 lakh and 31.96 lakh contracts, respectively. The maximum Put unwinding was seen at the 25,500 strike, which shed 5.34 lakh contracts, followed by the 25,600 and 25,400 strikes, which shed 1.52 lakh and 1.22 lakh contracts, respectively.
5) Bank Nifty Call Options Data
According to the monthly options data, the maximum Call open interest was observed at the 56,000 strike, with 13.76 lakh contracts. This can act as a key level for the index in the short term. It was followed by the 57,000 strike (12.34 lakh contracts) and the 57,500 strike (9.96 lakh contracts).
Maximum Call writing was visible at the 58,500 strike (with the addition of 1.2 lakh contracts), followed by the 57,100 strike (88,060 contracts), and the 57,200 strike (34,720 contracts). The maximum Call unwinding was seen at the 59,000 strike, which shed 1.48 lakh contracts, followed by the 56,800 and 56,700 strikes, which shed 80,045 and 78,820 contracts, respectively.
6) Bank Nifty Put Options Data
On the Put side, the 56,000 strike continues to hold the maximum Put open interest (with 22.36 lakh contracts), which can act as a key support level for the index. This was followed by the 57,000 strike (11.62 lakh contracts) and the 56,500 strike (7.78 lakh contracts).
The maximum Put writing was observed at the 56,500 strike (which added 1.13 lakh contracts), followed by the 56,800 strike (66,465 contracts) and the 56,000 strike (60,795 contracts). The maximum Put unwinding was seen at the 55,500 strike, which shed 47,495 contracts, followed by the 57,900 and 56,200 strikes, which shed 31,220 and 20,440 contracts, respectively.
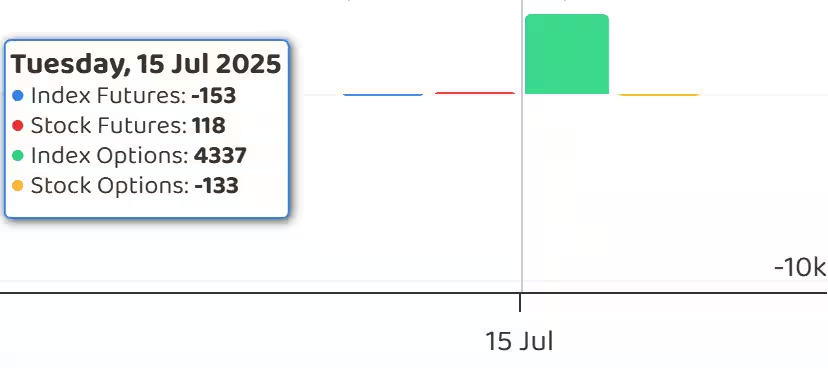
7) Funds Flow (Rs crore)
8) Put-Call Ratio
The Nifty Put-Call ratio (PCR), which indicates the mood of the market, climbed to 0.88 on July 15, compared to 0.72 in the previous session.
The increasing PCR, or being higher than 0.7 or surpassing 1, means traders are selling more Put options than Call options, which generally indicates the firming up of a bullish sentiment in the market. If the ratio falls below 0.7 or moves towards 0.5, then it indicates selling in Calls is higher than selling in Puts, reflecting a bearish mood in the market.
9) India VIX
The fear gauge, India VIX, declined sharply by 4.17 percent to 11.48 — its lowest closing level since April 26, 2024 — following a two-day uptrend. This drop adds to market confidence and boosts sentiment among market participants.
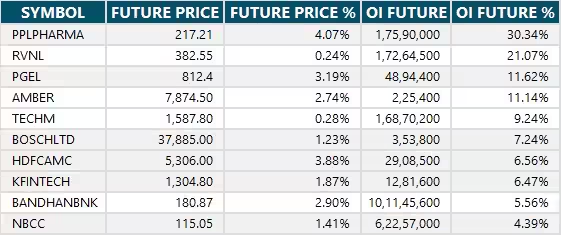
10) Long Build-up (76 Stocks)
A long build-up was seen in 76 stocks. An increase in open interest (OI) and price indicates a build-up of long positions.
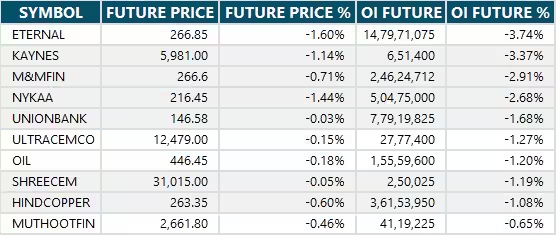
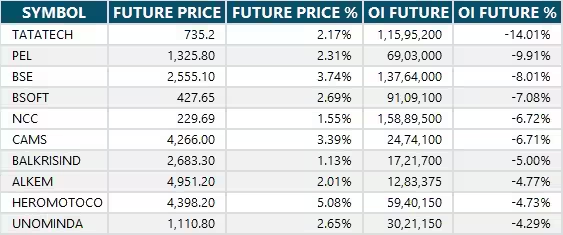
11) Long Unwinding (17 Stocks)
17 stocks saw a decline in open interest (OI) along with a fall in price, indicating long unwinding.
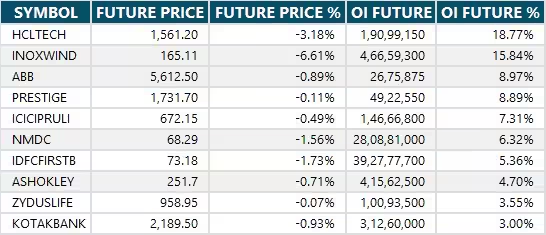
12) Short Build-up (33 Stocks)
33 stocks saw an increase in OI along with a fall in price, indicating a build-up of short positions.
13) Short-Covering (103 Stocks)
103 stocks saw short-covering, meaning a decrease in OI, along with a price increase.
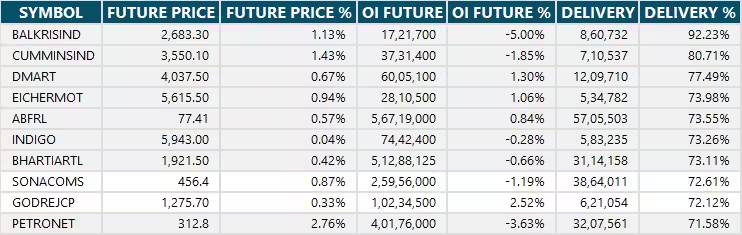
14) High Delivery Trades
Here are the stocks that saw a high share of delivery trades. A high share of delivery reflects investing (as opposed to trading) interest in a stock.
15) Stocks Under F&O Ban
Securities banned under the F&O segment include companies where derivative contracts cross 95 percent of the market-wide position limit.
Stocks added to F&O ban: Nil
Stocks retained in F&O ban: Glenmark Pharma, Hindustan Copper, RBL Bank
Stocks removed from F&O ban: Nil


0 Comment