15 May , 2025 By : Debdeep Gupta

The Nifty 50 remained within Monday's trading range and closed 0.4 percent higher on May 14 after a day of correction, while market breadth was dominated by the bulls for the third consecutive session. Given the supportive technical indicators, with the index trading well above all key moving averages, the bulls are likely to gradually drive the Nifty 50 toward the 24,800–25,000 zone in the upcoming sessions, as long as the index defends the crucial support zone at 24,380. The immediate support is placed at 24,500, according to experts.
Here are 15 data points we have collated to help you spot profitable trades:
1) Key Levels For The Nifty 50 (24,667)
Resistance based on pivot points: 24,745, 24,800, and 24,889
Support based on pivot points: 24,568, 24,513, and 24,425
Special Formation: The Nifty 50 formed a bullish candle with both upper and lower shadows on the daily charts, indicating range-bound trading. The index continued to trade well above key moving averages (5, 10, 20, 50, and 200-day EMAs), and on Wednesday, it successfully defended the short-term moving average (5-day EMA) on a closing basis. The MACD (Moving Average Convergence Divergence) maintained a positive crossover above the zero line, while the RSI (Relative Strength Index) remained strong, sustaining above the 60 mark at 61.49 — a signal of continued strength.
2) Key Levels For The Bank Nifty (54,801)
Resistance based on pivot points: 55,108, 55,277, and 55,551
Support based on pivot points: 54,559, 54,390, and 54,116
Resistance based on Fibonacci retracement: 56,291, 58,619
Support based on Fibonacci retracement: 54,115, 52,895
Special Formation: The Bank Nifty corrected and formed a bearish candlestick pattern for the second straight session, closing down by 0.25 percent. However, the index still traded above all key moving averages. Moreover, it not only defended the short-term moving averages (5- and 10-day EMAs) on a closing basis but also sustained above Monday's low, while taking support at the previous record high level from September 2024. All moving averages continue to trend upward.
3) Nifty Call Options Data
According to the weekly options data, the 25,000 strike holds the maximum Call open interest (with 1.46 crore contracts). This level can act as a key resistance for the Nifty in the short term. It was followed by the 25,500 strike (1.44 crore contracts), and the 25,200 strike (87.23 lakh contracts).
Maximum Call writing was observed at the 25,500 strike, which saw an addition of 28.57 lakh contracts, followed by the 25,000 and 25,200 strikes, which added 20.8 lakh and 18.9 lakh contracts, respectively. The maximum Call unwinding was seen at the 25,700 strike, which shed 33.47 lakh contracts, followed by the 24,500 and 24,200 strikes, which shed 6.33 lakh and 3.24 lakh contracts, respectively.
4) Nifty Put Options Data
On the Put side, the maximum Put open interest was seen at the 24,000 strike (with 1.22 crore contracts), which can act as a key support level for the Nifty. It was followed by the 24,500 strike (80.21 lakh contracts) and the 24,600 strike (69.93 lakh contracts).
The maximum Put writing was placed at the 24,000 strike, which saw an addition of 27.54 lakh contracts, followed by the 24,500 and 24,400 strikes, which added 21.34 lakh and 18.28 lakh contracts, respectively. The Put unwinding was seen at the 24,200 strike, which shed 8.52 lakh contracts, followed by the 24,750 and 25,000 strikes which shed 3.69 lakh and 3.39 lakh contracts, respectively.
5) Bank Nifty Call Options Data
According to the monthly options data, the 55,500 strike holds the maximum Call open interest, with 12.68 lakh contracts. This can act as a key resistance level for the index in the short term. It was followed by the 56,000 strike (12.07 lakh contracts) and the 55,000 strike (11.29 lakh contracts).
Maximum Call writing was visible at the 56,500 strike (with the addition of 1.09 lakh contracts), followed by the 54,700 strike (79,620 contracts) and the 55,500 strike (77,550 contracts). The maximum Call unwinding was seen at the 55,000 strike, which shed 1.42 lakh contracts, followed by the 54,000 and 56,000 strikes, which shed 1.36 lakh and 66,750 contracts, respectively.
6) Bank Nifty Put Options Data
On the Put side, the maximum Put open interest was seen at the 55,000 strike (with 17.56 lakh contracts), which can act as a key level for the index. This was followed by the 53,000 strike (12.1 lakh contracts) and the 54,000 strike (10.79 lakh contracts).
The maximum Put writing was observed at the 54,600 strike (which added 1.27 lakh contracts), followed by the 53,000 strike (93,120 contracts) and the 54,800 strike (47,850 contracts). The maximum Put unwinding was seen at the 55,500 strike, which shed 39,090 contracts, followed by the 55,200 and 53,700 strikes, which shed 33,570 and 26,730 contracts, respectively.
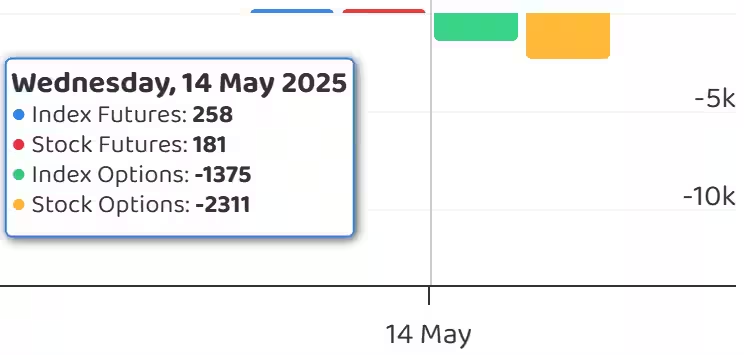
7) Funds Flow (Rs crore)
8) Put-Call Ratio
The Nifty Put-Call ratio (PCR), which indicates the mood of the market, rose to 0.89 on May 14, from 0.85 in the previous session.
The increasing PCR, or being higher than 0.7 or surpassing 1, means traders are selling more Put options than Call options, which generally indicates the firming up of a bullish sentiment in the market. If the ratio falls below 0.7 or moves towards 0.5, then it indicates selling in Calls is higher than selling in Puts, reflecting a bearish mood in the market.
9) India VIX
The India VIX, often referred to as the fear gauge, continued its downward trend for the third straight session, closing 5.36 percent lower at 17.23 levels. This decline provided further comfort to the bulls, with the VIX now trading below its short-term moving averages.
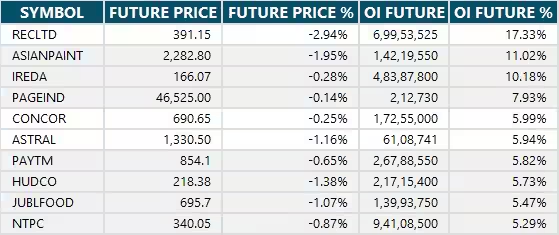
10) Long Build-up (86 Stocks)
A long build-up was seen in 86 stocks. An increase in open interest (OI) and price indicates a build-up of long positions

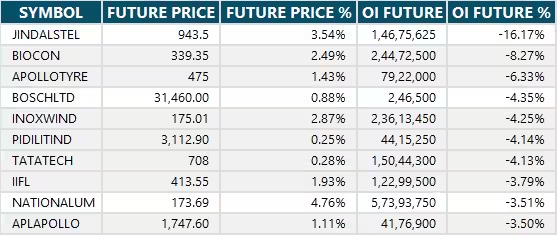
11) Long Unwinding (21 Stocks)
21 stocks saw a decline in open interest (OI) along with a fall in price, indicating long unwinding.
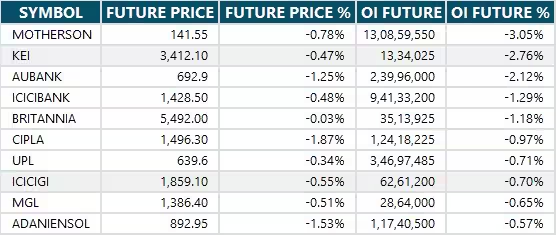
12) Short Build-up (31 Stocks)
31 stocks saw an increase in OI along with a fall in price, indicating a build-up of short positions.
13) Short-Covering (81 Stocks)
81 stocks saw short-covering, meaning a decrease in OI, along with a price increase.
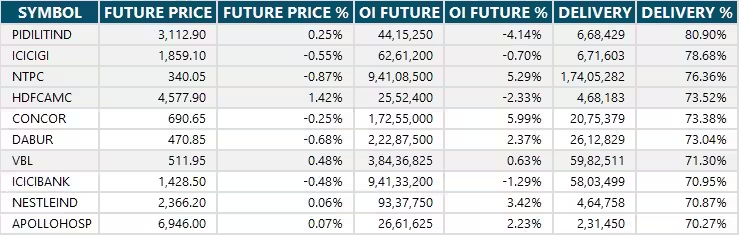
14) High Delivery Trades
Here are the stocks that saw a high share of delivery trades. A high share of delivery reflects investing (as opposed to trading) interest in a stock.
15) Stocks Under F&O Ban
Securities banned under the F&O segment include companies where derivative contracts cross 95 percent of the market-wide position limit.
Stocks added to F&O ban: Hindustan Copper
Stocks retained in F&O ban: Central Depository Services, Manappuram Finance
Stocks removed from F&O ban: Nil


0 Comment