19 Feb , 2026 By : Debdeep Gupta

The Nifty 50 bulls maintained control for three days in a row, rising 0.4 percent and making a good start to the monthly F&O expiry week on February 18. The continuation of the higher high–higher low formation, falling VIX, decisive breakout of the downward-sloping resistance trendline, and improving momentum indicators signalled a positive mood in the market. Hence, as long as the benchmark index holds above 25,750, a march toward 26,000 can be seen in the upcoming sessions. However, on the lower side, 25,650 (20-day EMA) can act as immediate support, followed by 25,500 (20-day DMA) as crucial support, according to experts.
Here are 15 data points we have collated to help you spot profitable trades:
1) Key Levels For The Nifty 50 (25,819)
Resistance based on pivot points: 25,834, 25,877, and 25,947
Support based on pivot points: 25,694, 25,651, and 25,581
Special Formation: The Nifty 50 formed a bullish candle with a long lower shadow on the daily timeframe and closed above the falling resistance trendline, signalling a positive trend with buying interest at lower levels. The index tested short- and medium-term moving averages, but at the close, it stayed above all key moving averages. The RSI rose to 53.91, while the MACD sustained above the reference line with strength in the histogram. All these indicators suggest strengthening momentum.
2) Key Levels For The Bank Nifty (61,551)
Resistance based on pivot points: 61,606, 61,723, and 61,912
Support based on pivot points: 61,227, 61,110, and 60,920
Resistance based on Fibonacci retracement: 62,077, 64,731
Support based on Fibonacci retracement: 60,695, 60,142
Special Formation: The Bank Nifty also formed a bullish candle, continuing its higher high–higher low formation, and ended at a new closing high as well as near the upper Bollinger Bands, signalling a healthy trend. The index stayed above all key moving averages (20-, 50-, 100-, and 200-day EMAs), which also trended upward. The RSI remained strong at 64.86, and the Stochastic RSI turned bullish, while the MACD stayed well above the signal line and zero line, with a further uptick in the histogram. All these indicators suggest sustained bullish momentum.
3) Nifty Call Options Data
According to the monthly options data, the maximum Call open interest was seen at the 26,000 strike (with 1.07 crore contracts). This level can act as a key resistance level for the Nifty in the short term. It was followed by the 26,500 strike (74.81 lakh contracts) and 25,800 strike (61.96 lakh contracts).
Maximum Call writing was observed at the 25,800 strike, which saw an addition of 18.46 lakh contracts, followed by the 26,000 and 26,500 strikes, which added 18.32 lakh and 13.84 lakh contracts, respectively. The maximum Call unwinding was seen at the 25,600 strike which shed 3.63 lakh contracts, followed by the 25,500 and 26,200 strikes, which shed 2.95 lakh and 2.27 lakh contracts, respectively.
4) Nifty Put Options Data
On the Put side, the 25,500 strike holds the maximum Put open interest (with 90.07 lakh contracts), which can act as a key support level for the Nifty in the short term. It was followed by the 25,700 strike (88.94 lakh contracts) and the 25,600 strike (67.82 lakh contracts).
The maximum Put writing was placed at the 25,700 strike, which saw an addition of 42.28 lakh contracts, followed by the 25,800 and 25,600 strikes, which added 28.38 lakh and 25.63 lakh contracts, respectively. The maximum Put unwinding was seen at the 26,300 strike, which shed 6,110 contracts, followed by the 26,500 strike, which shed 1,755 contracts.
5) Bank Nifty Call Options Data
According to the monthly options data, the maximum Call open interest was seen at the 62,000 strike, with 8.33 lakh contracts. This can act as a key resistance level for the index in the short term. It was followed by the 62,500 strike (8.15 lakh contracts) and the 61,500 strike (7.94 lakh contracts).
Maximum Call writing was observed at the 61,700 strike (with the addition of 3.02 lakh contracts), followed by the 61,500 strike (1.87 lakh contracts) and 62,500 strike (78,390 contracts). The maximum Call unwinding was seen at the 61,000 strike, which shed 2.69 lakh contracts, followed by the 61,100 and 61,300 strikes which shed 1.81 lakh and 1.55 lakh contracts, respectively.
6) Bank Nifty Put Options Data
On the Put side, the 61,000 strike holds the maximum Put open interest (with 11.86 lakh contracts), which can act as a key support level for the index. This was followed by the 60,500 strike (10.91 lakh contracts) and the 61,500 strike (5.93 lakh contracts).
The maximum Put writing was placed at the 61,500 strike (which added 4.08 lakh contracts), followed by the 61,000 strike (3.2 lakh contracts) and the 61,200 strike (2.67 lakh contracts). The maximum Put unwinding was seen at the 60,300 strike, which shed 22,710 contracts, followed by the 60,200 and 60,800 strikes, which shed 21,900 and 12,030 contracts, respectively.
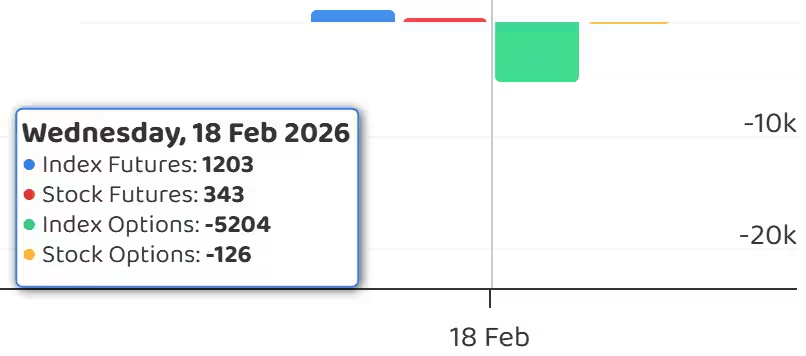
7) Funds Flow (Rs crore)
8) Put-Call Ratio
The Nifty Put-Call ratio (PCR), which indicates the mood of the market, rose to 1.22 (the highest closing level since January 2) on February 18, compared to 1.12 in the previous session.
The increasing PCR, or being higher than 0.7 or surpassing 1, means traders are selling more Put options than Call options, which generally indicates the firming up of a bullish sentiment in the market. If the ratio falls below 0.7 or moves towards 0.5, then it indicates selling in Calls is higher than selling in Puts, reflecting a bearish mood in the market.
9) India VIX
The fear gauge, India VIX, continued its downtrend for another session, falling 3.55 percent to 12.22 and staying below the 10-, 20-, and 200-day EMAs, signalling comfort for bulls. A decisive fall further below in the following sessions can bring major comfort to bulls.
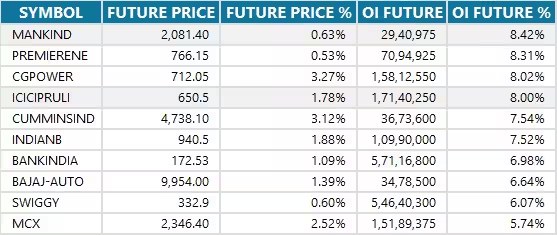
10) Long Build-up (101 Stocks)
A long build-up was seen in 101 stocks. An increase in open interest (OI) and price indicates a build-up of long positions.
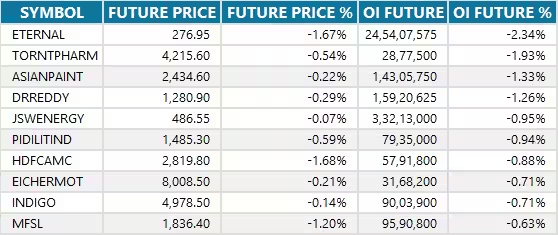
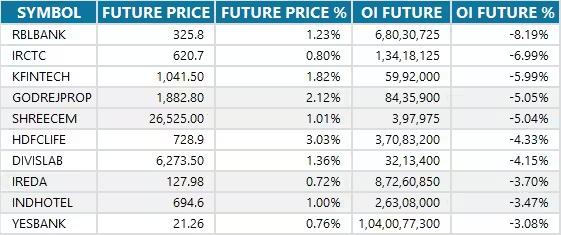
11) Long Unwinding (16 Stocks)
16 stocks saw a decline in open interest (OI) along with a fall in price, indicating long unwinding.
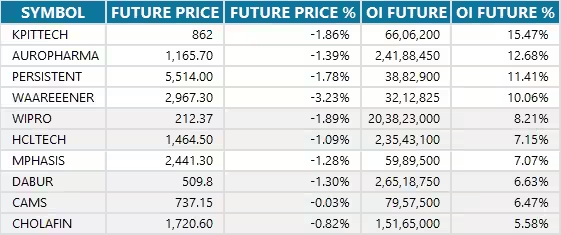
12) Short Build-up (41 Stocks)
41 stocks saw an increase in OI along with a fall in price, indicating a build-up of short positions.
13) Short-Covering (53 Stocks)
53 stocks saw short-covering, meaning a decrease in OI, along with a price increase.
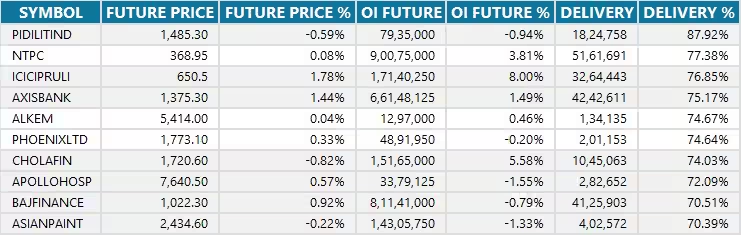
14) High Delivery Trades
Here are the stocks that saw a high share of delivery trades. A high share of delivery reflects investing (as opposed to trading) interest in a stock.
15) Stocks Under F&O Ban
Securities banned under the F&O segment include companies where derivative contracts cross 95 percent of the market-wide position limit.
Stocks added to F&O ban: Nil
Stocks retained in F&O ban: SAIL, Sammaan Capital
Stocks removed from F&O ban: Nil


0 Comment