27 Mar , 2025 By : Debdeep Gupta

The profit booking stepped in on March 26 (a day before the monthly expiry of derivative contracts), dragging the benchmark Nifty 50 down by 182 points. This was expected after a more than 1,500-point rally over the previous seven consecutive sessions. Despite the decline, the index remained above all key moving averages, with the expansion of Bollinger Bands, which is a positive sign, according to experts. The index is likely to consolidate further, with immediate support at 23,400 (which coincides with the 200-day EMA). Below this level, the 23,200 mark is the next level to watch. On the upside, 23,800 is expected to remain a key hurdle.
Here are 15 data points we have collated to help you spot profitable trades:
1) Key Levels For The Nifty 50 (23,487)
Resistance based on pivot points: 23,667, 23,734, and 23,843
Support based on pivot points: 23,450, 23,382, and 23,274
Special Formation: The Nifty 50 formed a long bearish candlestick pattern on the daily charts, indicating a potential negative trend ahead. However, the index still sustained above all key moving averages (10, 20, 50, 100, and 200-day EMAs), with short-term moving averages crossing above medium-term moving averages on the daily scale. The momentum indicator RSI (Relative Strength Index) is at 50.2 and has been inching upward on the weekly scale.
2) Key Levels For The Bank Nifty (51,209)
Resistance based on pivot points: 51,693, 51,883, and 52,191
Support based on pivot points: 51,076, 50,886, and 50,578
Resistance based on Fibonacci retracement: 51,883, 53,020
Support based on Fibonacci retracement: 50,273, 49,283
Special Formation: The Bank Nifty also formed a bearish candlestick pattern on the daily timeframe, but the trend remains upward, as the index traded above all key moving averages. Short-term moving averages have crossed above medium and long-term moving averages, and the Bollinger Bands remain in expansion mode. On the weekly scale, the momentum indicators RSI is at 55.08 and is trending higher, while the MACD saw a positive crossover (though it is still below the zero line).
3) Nifty Call Options Data
According to the monthly options data, the 24,000 strike holds the maximum Call open interest (with 1.56 crore contracts). This level can act as a key resistance for the Nifty in the short term. It was followed by the 24,100 strike (1.21 crore contracts), and the 24,500 strike (1.11 crore contracts).
Maximum Call writing was observed at the 23,600 strike, which saw an addition of 40.11 lakh contracts, followed by the 23,500 and 23,700 strikes, which added 33.63 lakh and 30.85 lakh contracts, respectively. The maximum Call unwinding was seen at the 24,400 strike, which shed 16.43 lakh contracts, followed by the 24,500 and 23,200 strikes, which shed 14.32 lakh and 9.13 lakh contracts, respectively.
4) Nifty Put Options Data
On the Put side, the maximum Put open interest was seen at the 23,000 strike (with 1.17 crore contracts), which can act as a key support level for the Nifty. It was followed by the 22,500 strike (1.06 crore contracts) and the 23,300 strike (79.08 lakh contracts).
The maximum Put writing was placed at the 22,600 strike, which saw an addition of 18.64 lakh contracts, followed by the 23,400 and 23,450 strikes, which added 10.52 lakh and 10.14 lakh contracts, respectively. The maximum Put unwinding was seen at the 22,500 strike, which shed 21.35 lakh contracts, followed by the 23,600 and 23,000 strikes, which shed 15.71 lakh and 13.08 lakh contracts, respectively.
5) Bank Nifty Call Options Data
According to the monthly options data, the maximum Call open interest was seen at the 53,000 strike, with 26.62 lakh contracts. This can act as a key resistance level for the index in the short term. It was followed by the 52,000 strike (19.86 lakh contracts) and the 52,500 strike (18.21 lakh contracts).
Maximum Call writing was visible at the 51,500 strike (with the addition of 7.19 lakh contracts), followed by the 52,500 strike (6.53 lakh contracts) and the 51,300 strike (5.22 lakh contracts). The maximum Call unwinding was seen at the 53,200 strike, which shed 88,860 contracts, followed by the 53,300 and 50,900 strikes, which shed 49,290 and 39,120 contracts, respectively.
6) Bank Nifty Put Options Data
On the Put side, the 50,000 strike holds the maximum Put open interest (with 17.42 lakh contracts), which can act as a key support level for the index. This was followed by the 49,500 strike (13.53 lakh contracts) and the 51,000 strike (11.69 lakh contracts).
The maximum Put writing was observed at the 51,200 strike (which added 2.96 lakh contracts), followed by the 51,300 strike (1.98 lakh contracts) and the 49,300 strike (1.61 lakh contracts). The maximum Put unwinding was seen at the 51,600 strike, which shed 1.54 lakh contracts, followed by the 51,500 and 51,800 strikes, which shed 1.52 lakh and 1.51 lakh contracts, respectively.
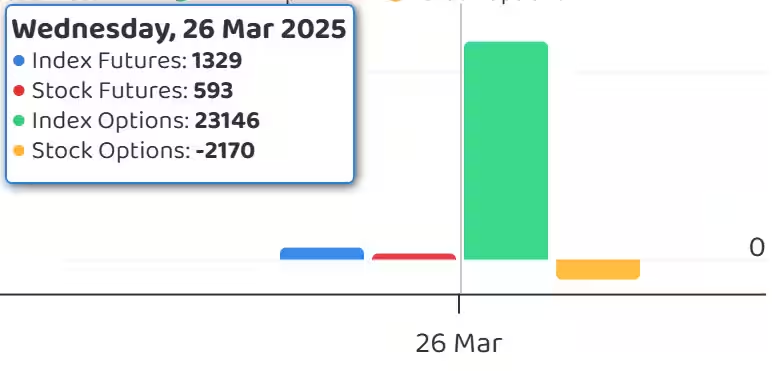
7) Funds Flow (Rs crore)
8) Put-Call Ratio
The Nifty Put-Call ratio (PCR), which indicates the mood of the market, fell further to 0.92 on March 26, against 1.04 in the previous session.
The increasing PCR, or being higher than 0.7 or surpassing 1, means traders are selling more Put options than Call options, which generally indicates the firming up of a bullish sentiment in the market. If the ratio falls below 0.7 or moves towards 0.5, then it indicates selling in Calls is higher than selling in Puts, reflecting a bearish mood in the market.
9) India VIX
The India VIX, the fear gauge, extended its downtrend for another session, falling by 1.21% to 13.47. However, it needs to sustain below the 13 mark for the bulls to feel comfortable.
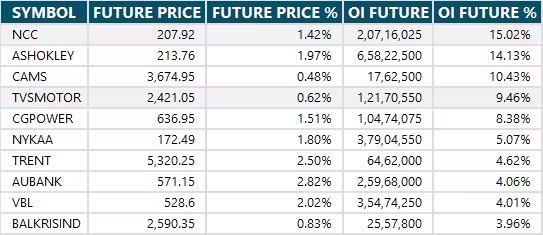
10) Long Build-up (35 Stocks)
A long build-up was seen in 35 stocks. An increase in open interest (OI) and price indicates a build-up of long positions.
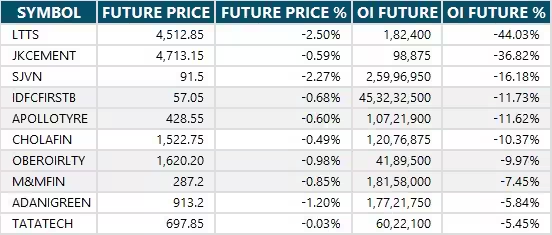
11) Long Unwinding (63 Stocks)
63 stocks saw a decline in open interest (OI) along with a fall in price, indicating long unwinding.
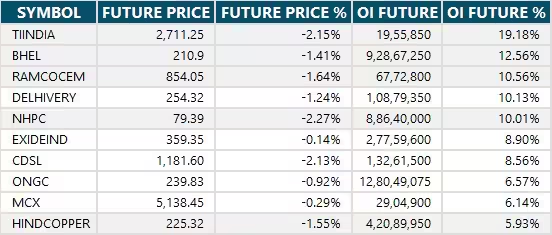
12) Short Build-up (89 Stocks)
89 stocks saw an increase in OI along with a fall in price, indicating a build-up of short positions.
13) Short-Covering (31 Stocks)
31 stocks saw short-covering, meaning a decrease in OI, along with a price increase.
14) High Delivery Trades
Here are the stocks that saw a high share of delivery trades. A high share of delivery reflects investing (as opposed to trading) interest in a stock.
15) Stocks Under F&O Ban
Securities banned under the F&O segment include companies where derivative contracts cross 95 percent of the market-wide position limit.
Stocks added to F&O ban: Hindustan Copper
Stocks retained in F&O ban: Nil
Stocks removed from F&O ban: IndusInd Bank


0 Comment