30 Jul , 2025 By : Debdeep Gupta

The Nifty 50 snapped a three-day losing streak and gained 0.6 percent on July 29 after taking support at the 100-day EMA (24,580), but the lower highs–lower lows formation continued for the third consecutive session, and the index remained below the 50-day EMA (24,950). Hence, unless the index sustains above 24,950, rangebound trading is expected to continue, with immediate support at 24,700, followed by 24,600 as key support. Above this, 25,100 is the level to watch, according to experts.
Here are 15 data points we have collated to help you spot profitable trades:
1) Key Levels For The Nifty 50 (24,821)
Resistance based on pivot points: 24,851, 24,909, and 25,004
Support based on pivot points: 24,661, 24,602, and 24,507
Special Formation: The Nifty 50 formed a bullish candle, resembling a Bullish Engulfing kind of candlestick pattern on the daily charts, which appeared near the 100-day EMA in a weak market. The follow-up session is important to watch for confirmation of this bullish reversal pattern. The index still sustained below the short-term (10- and 20-day EMA) and medium-term (50-day EMA) moving averages. The weakness in the MACD histogram is waning, while the RSI inclined upward and came back above the 40 mark at 42.05, though it remained in a bearish crossover.
2) Key Levels For The Bank Nifty (56,222)
Resistance based on pivot points: 56,294, 56,401, and 56,574
Support based on pivot points: 55,947, 55,840, and 55,667
Resistance based on Fibonacci retracement: 56,325, 56,648
Support based on Fibonacci retracement: 55,666, 55,124
Special Formation: The Bank Nifty gained 0.24 percent and also formed a bullish candle on the daily charts, but underperformed the benchmark Nifty 50 and continued the lower tops–lower bottoms formation for the third consecutive session. The banking index came back above the 50-day EMA with above-average volumes and managed to defend the downward-sloping support trendline but still traded below short-term moving averages. The Stochastic RSI and MACD maintained a bearish crossover, with the MACD weakening further.
3) Nifty Call Options Data
According to the monthly options data, the 25,000 strike holds the maximum Call open interest (with 1.4 crore contracts). This level can act as a key resistance for the Nifty in the short term. It was followed by the 25,500 strike (1.148 crore contracts), and the 25,200 strike (1.1479 crore contracts).
Maximum Call writing was observed at the 25,150 strike, which saw an addition of 2.5 lakh contracts, followed by the 24,550 and 24,450 strikes, which added 92,775 and 10,575 contracts, respectively. The maximum Call unwinding was seen at the 24,800 strike, which shed 30.79 lakh contracts, followed by the 25,600 and 25,400 strikes, which shed 19.47 lakh and 17.65 lakh contracts, respectively.
4) Nifty Put Options Data
On the Put side, the maximum Put open interest was seen at the 24,000 strike (with 1.21 crore contracts), which can act as a key support level for the Nifty. It was followed by the 24,800 strike (88.33 lakh contracts) and the 24,700 strike (85.54 lakh contracts).
The maximum Put writing was placed at the 24,800 strike, which saw an addition of 43.91 lakh contracts, followed by the 24,000 and 24,700 strikes, which added 37.28 lakh and 34.86 lakh contracts, respectively. The maximum Put unwinding was seen at the 25,000 strike, which shed 8.31 lakh contracts, followed by the 25,100 and 25,200 strikes, which shed 7.91 lakh and 4.95 lakh contracts, respectively.
5) Bank Nifty Call Options Data
According to the monthly options data, the maximum Call open interest was seen at the 57,000 strike, with 23.15 lakh contracts. This can act as a key resistance level for the index in the short term. It was followed by the 57,500 strike (18.7 lakh contracts) and the 58,000 strike (14.58 lakh contracts).
Maximum Call writing was visible at the 57,500 strike (with the addition of 3.48 lakh contracts), followed by the 56,300 strike (2.84 lakh contracts), and the 56,200 strike (1.44 lakh contracts). The maximum Call unwinding was seen at the 57,400 strike, which shed 1.62 lakh contracts, followed by the 58,000 and 58,200 strikes, which shed 1.23 lakh and 1.19 lakh contracts, respectively.
6) Bank Nifty Put Options Data
On the Put side, the 56,000 strike holds the maximum Put open interest (with 13.09 lakh contracts), which can act as a key support level for the index. This was followed by the 55,000 strike (11.44 lakh contracts) and the 55,500 strike (7.74 lakh contracts).
The maximum Put writing was observed at the 56,300 strike (which added 2.2 lakh contracts), followed by the 55,000 strike (1.25 lakh contracts) and the 56,100 strike (1.23 lakh contracts). The maximum Put unwinding was seen at the 57,000 strike, which shed 1.64 lakh contracts, followed by the 56,500 and 55,400 strikes, which shed 1.3 lakh and 82,915 contracts, respectively.
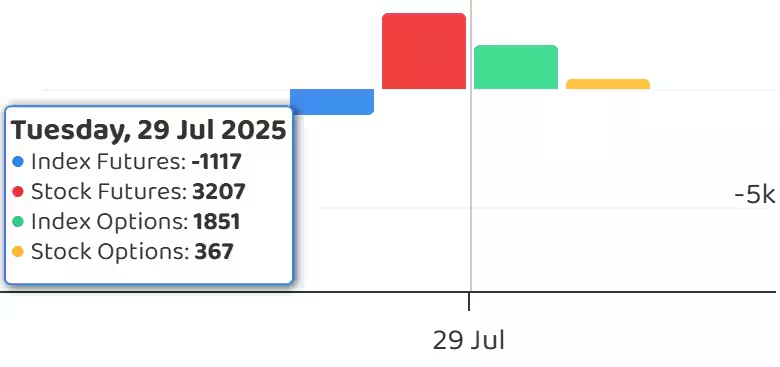
7) Funds Flow (Rs crore)
8) Put-Call Ratio
The Nifty Put-Call ratio (PCR), which indicates the mood of the market, jumped to 0.8 on July 29, compared to 0.64 in the previous session.
The increasing PCR, or being higher than 0.7 or surpassing 1, means traders are selling more Put options than Call options, which generally indicates the firming up of a bullish sentiment in the market. If the ratio falls below 0.7 or moves towards 0.5, then it indicates selling in Calls is higher than selling in Puts, reflecting a bearish mood in the market.
9) India VIX
The India VIX, which measures expected market volatility, dropped 4.46 percent to 11.53 after rising for the previous three straight sessions, giving comfort to the bulls.
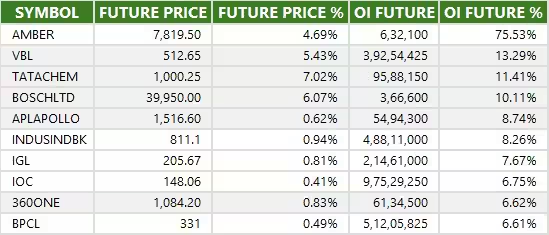
10) Long Build-up (89 Stocks)
A long build-up was seen in 89 stocks. An increase in open interest (OI) and price indicates a build-up of long positions.
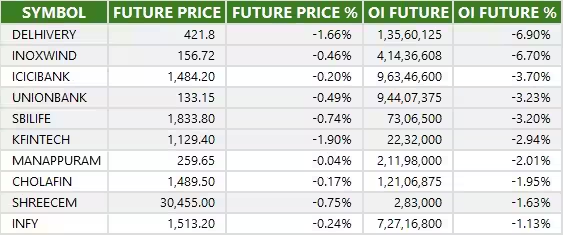
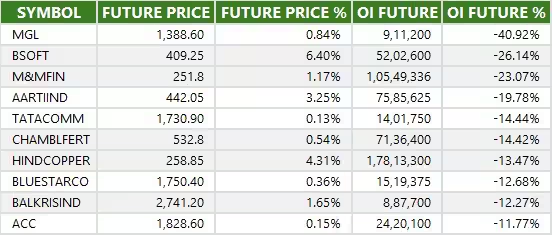
11) Long Unwinding (22 Stocks)
22 stocks saw a decline in open interest (OI) along with a fall in price, indicating long unwinding.
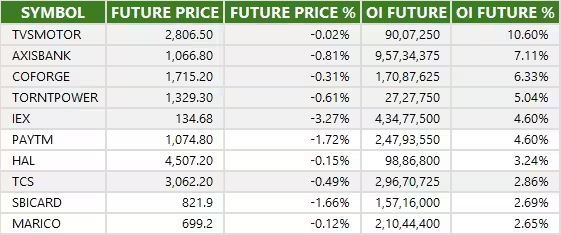
12) Short Build-up (26 Stocks)
26 stocks saw an increase in OI along with a fall in price, indicating a build-up of short positions.
13) Short-Covering (92 Stocks)
92 stocks saw short-covering, meaning a decrease in OI, along with a price increase.
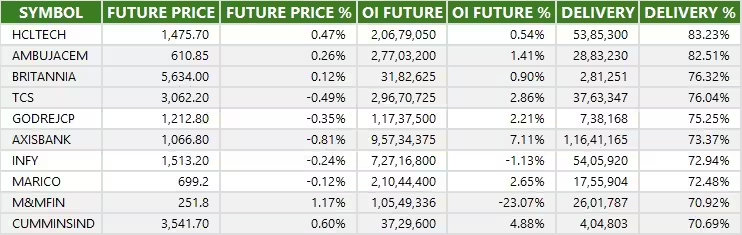
14) High Delivery Trades
Here are the stocks that saw a high share of delivery trades. A high share of delivery reflects investing (as opposed to trading) interest in a stock.
15) Stocks Under F&O Ban
Securities banned under the F&O segment include companies where derivative contracts cross 95 percent of the market-wide position limit.
Stocks added to F&O ban: Nil
Stocks retained in F&O ban: RBL Bank
Stocks removed from F&O ban: Nil


0 Comment