29 Jan , 2025 By : Debdeep Gupta

The Nifty 50 recovered some of its previous day's losses and closed six-tenths of a percent higher on January 28, but could not sustain above the 23,000 mark, a crucial hurdle, given the caution ahead of the Budget. If the index manages to sustain above 23,000 amid overall bearish sentiment and elevated volatility, the upward journey toward 23,100 and then 23,300 could be possible. However, if it fails to hold above this level, the 22,800-22,750 range could act as a support zone. A break below this could drive the index down to 22,600, experts said.
Here are 15 data points we have collated to help you spot profitable trades:
1) Key Levels For The Nifty 50 (22,957)
Resistance based on pivot points: 23,091, 23,157, and 23,264
Support based on pivot points: 22,877, 22,811, and 22,704
Special Formation: The Nifty 50 formed a Doji candlestick pattern on the daily charts with above-average volumes, indicating indecision among bulls and bears, though there was a higher high-higher low formation. The index still traded below all key moving averages (10, 20, 50, 100, and 200-day EMAs), and the momentum indicators remained in negative territory.
2) Key Levels For The Bank Nifty (48,867)
Resistance based on pivot points: 49,159, 49,348, and 49,652
Support based on pivot points: 48,550, 48,361, and 48,056
Resistance based on Fibonacci retracement: 49,409, 50,381
Support based on Fibonacci retracement: 47,869, 46,078
Special Formation: The Bank Nifty saw a gap-up opening and formed a bullish candlestick pattern with a long upper wick and small lower shadow on the daily timeframe, indicating selling pressure at higher levels. The index moved closer to the midline of the Bollinger Bands intraday and closed 1.67 percent higher with significant volumes for another session. Overall, sentiment remains bearish with negativity in momentum indicators, and the index traded below the 20, 50, 100, and 200-day EMAs.
3) Nifty Call Options Data
According to the monthly options data, the maximum Call open interest was seen at the 24,000 strike (with 1.2 crore contracts). This level can act as a key resistance for the Nifty in the short term. It was followed by the 23,000 strike (86.21 lakh contracts) and the 23,500 strike (74.32 lakh contracts).
Maximum Call writing was observed at the 23,700 strike, which saw an addition of 10.69 lakh contracts, followed by the 23,650 and 22,100 strikes, which added 5.92 lakh and 3.7 lakh contracts, respectively. The maximum Call unwinding was seen at the 23,750 strike which shed 13.58 lakh contracts, followed by the 23,200 and 23,800 strikes which shed 13.4 lakh and 10.36 lakh contracts, respectively.
4) Nifty Put Options Data
On the Put side, the 22,000 strike holds the maximum Put open interest (with 1.21 crore contracts), which can act as a key support level for the Nifty. It was followed by the 23,000 strike (1.01 crore contracts) and the 22,500 strike (63.62 lakh contracts).
The maximum Put writing was placed at the 23,000 strike, which saw an addition of 49.39 lakh contracts, followed by the 22,900 and 22,000 strikes, which added 32.76 lakh and 25.1 lakh contracts, respectively. The maximum Put unwinding was seen at the 23,500 strike, which shed 3.94 lakh contracts, followed by the 24,000 and 22,600 strikes, which shed 3.04 lakh and 2.75 lakh contracts, respectively.
5) Bank Nifty Call Options Data
According to the monthly options data, the maximum Call open interest was seen at the 51,000 strike, with 27.59 lakh contracts. This can act as a key resistance level for the index in the short term. It was followed by the 50,000 strike (22.42 lakh contracts) and the 50,500 strike (17.62 lakh contracts).
Maximum Call writing was visible at the 50,200 strike (with the addition of 8.37 lakh contracts), followed by the 50,600 strike (1.81 lakh contracts) and the 50,800 strike (1.35 lakh contracts). The maximum Call unwinding was seen at the 49,000 strike, which shed 13.05 lakh contracts, followed by the 50,000 and 51,000 strikes, which shed 8.74 lakh and 8.1 lakh contracts, respectively.
6) Bank Nifty Put Options Data
On the Put side, the 47,000 strike holds the maximum Put open interest (with 19.52 lakh contracts), which can act as a key support level for the index. This was followed by the 48,000 strike (16.6 lakh contracts) and the 47,800 strike (14.55 lakh contracts).
The maximum Put writing was observed at the 47,800 strike (which added 9.88 lakh contracts), followed by the 48,800 strike (5.07 lakh contracts) and the 49,000 strike (4.42 lakh contracts). The maximum Put unwinding was seen at the 47,000 strike, which shed 6.49 lakh contracts, followed by the 47,900 and 50,000 strikes which shed 61,005 and 54,840 contracts, respectively.
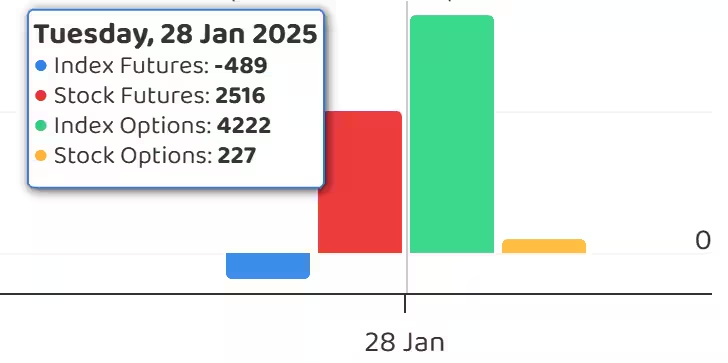
7) Funds Flow (Rs crore)
8) Put-Call Ratio
The Nifty Put-Call ratio (PCR), which indicates the mood of the market, climbed to 0.95 on January 28, from 0.75 level in the previous session.
The increasing PCR, or being higher than 0.7 or surpassing 1, means traders are selling more Put options than Call options, which generally indicates the firming up of a bullish sentiment in the market. If the ratio falls below 0.7 or moves towards 0.5, then it indicates selling in Calls is higher than selling in Puts, reflecting a bearish mood in the market.
9) India VIX
The India VIX, the fear gauge that measures expected market volatility, rose by 0.34 percent to 18.20, marking the highest closing level since August 6, 2024. This elevated volatility ahead of the Union Budget is expected to keep the bulls cautious.
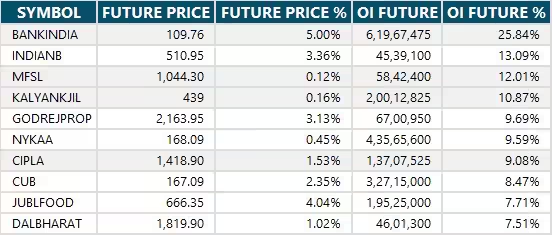
10) Long Build-up (57 Stocks)
A long build-up was seen in 57 stocks. An increase in open interest (OI) and price indicates a build-up of long positions.
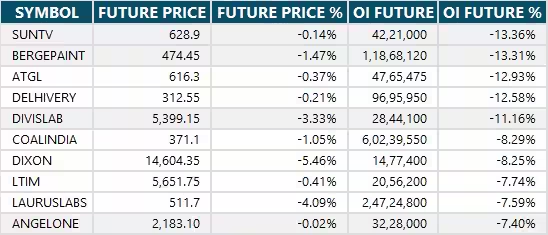
11) Long Unwinding (56 Stocks)
56 stocks saw a decline in open interest (OI) along with a fall in price, indicating long unwinding.
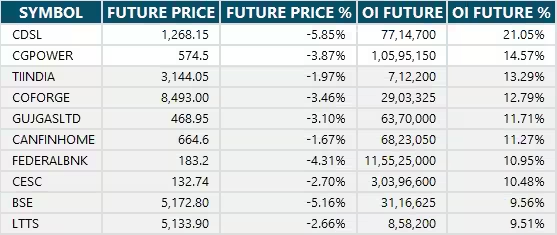
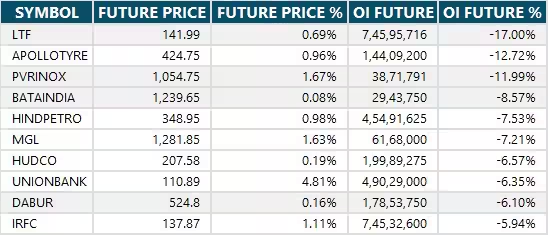
12) Short Build-up (61 Stocks)
61 stocks saw an increase in OI along with a fall in price, indicating a build-up of short positions.
13) Short-Covering (54 Stocks)
54 stocks saw short-covering, meaning a decrease in OI, along with a price increase.
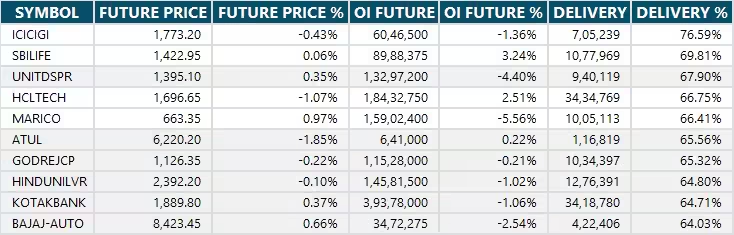
14) High Delivery Trades
Here are the stocks that saw a high share of delivery trades. A high share of delivery reflects investing (as opposed to trading) interest in a stock.
15) Stocks Under F&O Ban
Securities banned under the F&O segment include companies where derivative contracts cross 95 percent of the market-wide position limit.
Stocks added to F&O ban: Nil
Stocks retained in F&O ban: Nil
Stocks removed from F&O ban: IndiaMART InterMESH, Manappuram Finance, Mahanagar Gas, Punjab National Bank


0 Comment