14 Aug , 2025 By : Debdeep Gupta

The Nifty 50 bounced back on August 13, maintaining a higher lows formation for the third consecutive session, gaining 0.54 percent ahead of the weekly F&O expiry on August 14. The index climbed above the 100-day EMA (24,589), which is a positive sign, but sustainability will be key to watch moving forward. This level can act as immediate support, with Tuesday’s low of 24,465 serving as the next key support. As long as the index holds these support levels, the upward journey toward the 24,700 (immediate hurdle) and then 24,800–24,850 (a crucial hurdle) remains possible in the upcoming sessions, according to experts.
Here are 15 data points we have collated to help you spot profitable trades:
1) Key Levels For The Nifty 50 (24,619)
Resistance based on pivot points: 24,656, 24,686, and 24,736
Support based on pivot points: 24,557, 24,526, and 24,477
Special Formation: The Nifty 50 formed a bullish candle with both upper and lower shadows on the daily chart, indicating range-bound trading with a positive bias, but lacking strong momentum. The index appears to be inching closer to the midline of the Bollinger Bands, which could be a possible outcome after decisively clearing the 24,700 zone. The Stochastic RSI maintained a bullish crossover and entered the upper band. The RSI at 44.13 also showed a positive crossover, while the histogram weakness faded further, although the MACD and the signal line remain below the zero line. This suggests that the market may be showing signs of gradual improvement.
2) Key Levels For The Bank Nifty (55,181)
Resistance based on pivot points: 55,302, 55,376, and 55,496
Support based on pivot points: 55,063, 54,989, and 54,870
Resistance based on Fibonacci retracement: 55,941, 56,263
Support based on Fibonacci retracement: 54,405, 53,403
Special Formation: The Bank Nifty formed a bearish candle with a minor lower shadow within the previous day's long red candle on the daily timeframe. Despite this, the index has strongly held onto the 100-day EMA since August 7. This formation resembles a Homing Pigeon candlestick pattern, typically seen after a downtrend, and is generally considered a bullish reversal signal. This suggests that selling pressure may be easing, but confirmation will be required in the next session. The RSI at 39.35 is on the verge of a bullish crossover, while the Stochastic RSI has maintained its positive crossover. The weakness in the histogram is easing, although the MACD remains below the zero line. This indicates that the potential for a rebound may be building, but further confirmation is needed.
3) Nifty Call Options Data
According to the weekly options data, the maximum Call open interest was seen at the 25,000 strike (with 1.58 crore contracts). This level can act as a key resistance for the Nifty in the short term. It was followed by the 24,700 strike (1.27 crore contracts), and the 24,800 strike (97.05 lakh contracts).
Maximum Call writing was observed at the 24,950 strike, which saw an addition of 14.15 lakh contracts, followed by the 25,050 and 24,750 strikes, which added 10.34 lakh and 10.3 lakh contracts, respectively. The maximum Call unwinding was seen at the 24,500 strike, which shed 51.53 lakh contracts, followed by the 24,550 and 24,600 strikes, which shed 28.86 lakh and 26.46 lakh contracts, respectively.
4) Nifty Put Options Data
On the Put side, the 24,600 strike holds the maximum Put open interest (with 1.53 crore contracts), which can act as a key support level for the Nifty. It was followed by the 24,500 strike (1.41 crore contracts) and the 24,000 strike (1.34 crore contracts).
The maximum Put writing was placed at the 24,600 strike, which saw an addition of 1.1 crore contracts, followed by the 24,500 and 24,550 strikes, which added 60.47 lakh and 56.88 lakh contracts, respectively. The maximum Put unwinding was seen at the 25,500 strike, which shed 71,550 contracts, followed by the 25,200 and 25,100 strikes, which shed 67,800 and 55,500 contracts, respectively.
5) Bank Nifty Call Options Data
According to the monthly options data, the 57,000 strike continued to hold the maximum Call open interest, with 24.52 lakh contracts. This can act as a key resistance level for the index in the short term. It was followed by the 56,000 strike (15.11 lakh contracts) and the 55,500 strike (12.32 lakh contracts).
Maximum Call writing was observed at the 55,200 strike (with the addition of 82,180 contracts), followed by the 57,000 strike (70,525 contracts), and the 56,000 strike (33,775 contracts). The maximum Call unwinding was seen at the 55,000 strike, which shed 54,460 contracts, followed by the 55,300 and 56,700 strikes, which shed 32,340 contracts, and 20,860 contracts, respectively.
6) Bank Nifty Put Options Data
On the Put side, the maximum Put open interest was seen at the 57,000 strike (with 13.19 lakh contracts), which can act as a key level for the index. This was followed by the 55,000 strike (10.28 lakh contracts) and the 55,500 strike (8.66 lakh contracts).
The maximum Put writing was observed at the 55,000 strike (which added 47,460 contracts), followed by the 55,200 strike (42,420 contracts) and the 55,100 strike (32,445 contracts). The maximum Put unwinding was seen at the 55,300 strike, which shed 25,900 contracts, followed by the 53,500 and 54,300 strikes, which shed 21,910 and 13,930 contracts, respectively.
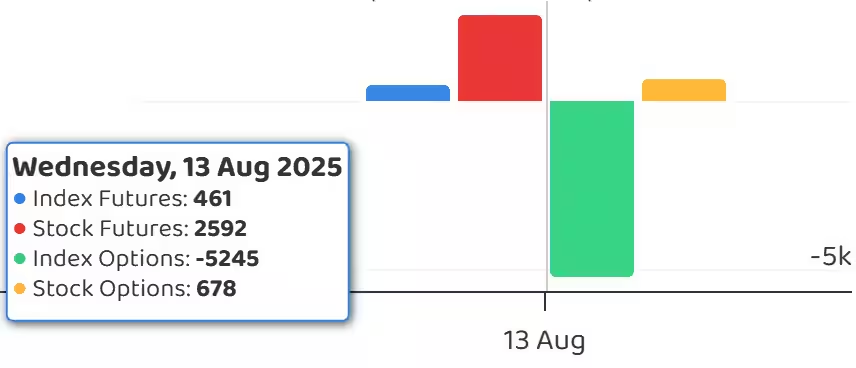
7) Funds Flow (Rs crore)
8) Put-Call Ratio
The Nifty Put-Call ratio (PCR), which indicates the mood of the market, rose to 1.08 on August 13, compared to 0.78 in the previous session.
The increasing PCR, or being higher than 0.7 or surpassing 1, means traders are selling more Put options than Call options, which generally indicates the firming up of a bullish sentiment in the market. If the ratio falls below 0.7 or moves towards 0.5, then it indicates selling in Calls is higher than selling in Puts, reflecting a bearish mood in the market.
9) India VIX
The India VIX, also known as the fear gauge, stayed above its short-term moving averages as well as the 12-zone, though it fell 0.76 percent to 12.14 after a three-day uptrend. This indicates that while fear levels have subsided slightly, there is still an underlying sense of caution in the market.
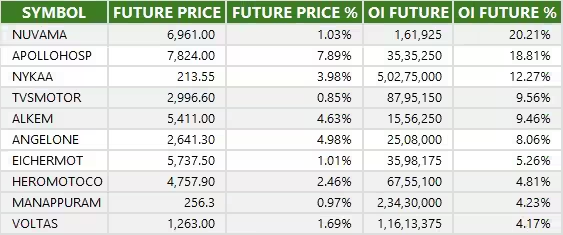
10) Long Build-up (100 Stocks)
A long build-up was seen in 100 stocks. An increase in open interest (OI) and price indicates a build-up of long positions.
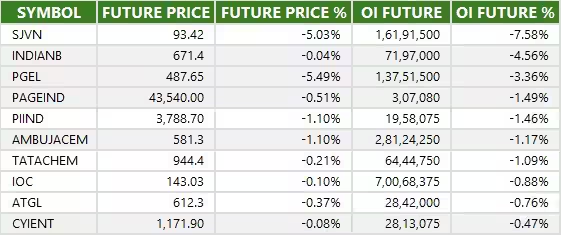
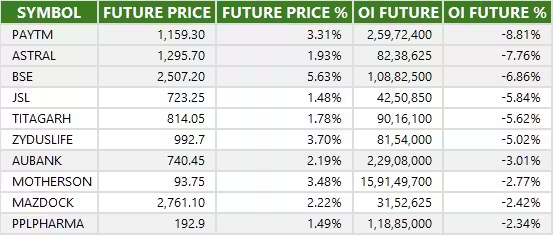
11) Long Unwinding (13 Stocks)
13 stocks saw a decline in open interest (OI) along with a fall in price, indicating long unwinding.
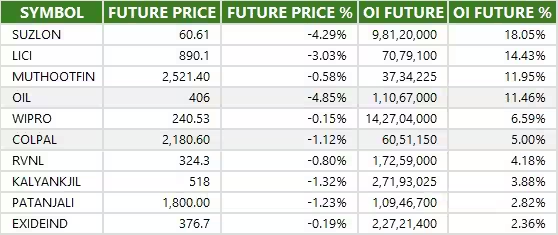
12) Short Build-up (37 Stocks)
37 stocks saw an increase in OI along with a fall in price, indicating a build-up of short positions.
13) Short-Covering (70 Stocks)
70 stocks saw short-covering, meaning a decrease in OI, along with a price increase.
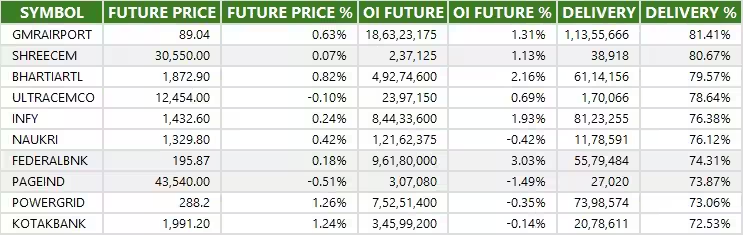
14) High Delivery Trades
Here are the stocks that saw a high share of delivery trades. A high share of delivery reflects investing (as opposed to trading) interest in a stock.
15) Stocks Under F&O Ban
Securities banned under the F&O segment include companies where derivative contracts cross 95 percent of the market-wide position limit.
Stocks added to F&O ban: Nil
Stocks retained in F&O ban: PG Electroplast, PNB Housing Finance, RBL Bank, Titagarh Rail Systems
Stocks removed from F&O ban: Nil


0 Comment