05 May , 2025 By : Debdeep Gupta

The market closed flat for the third consecutive session on May 2, after witnessing significant pressure at higher levels due to elevated VIX amid geopolitical tension between India and Pakistan. A healthy trend remains intact, given that the benchmark Nifty 50 stayed above all key moving averages. In the upcoming sessions, the index may trade in the range of 24,000–24,600 (around the previous week's high-low). A decisive breakout above the upper range can take the index toward 24,860 (the December 2024 swing high), while a breakdown below the lower range can drag it down to 23,850 (the recent swing low), which is a crucial support, according to experts.
Here are 15 data points we have collated to help you spot profitable trades:
1) Key Levels For The Nifty 50 (24,347)
Resistance based on pivot points: 24,525, 24,608, and 24,742
Support based on pivot points: 24,257, 24,175, and 24,041
Special Formation: The Nifty 50 formed a small bullish candle with a long upper shadow on the daily charts, indicating pressure at higher levels, while the volume was above average. The index made a healthy attempt to surpass the 61.8 percent retracement level (24,550) last Friday. It traded well above all key moving averages, with all EMAs (10, 20, 50, 100, and 200-day) trending upward. Notably, the 50-day EMA is on the verge of crossing above the 200-day EMA—a golden crossover—which, if confirmed, signals a strong trend ahead. The RSI (Relative Strength Index) sustained above 60, at 65.18, and the MACD (Moving Average Convergence Divergence) continued trending upward.
2) Key Levels For The Bank Nifty (55,115)
Resistance based on pivot points: 55,534, 55,698, and 55,965
Support based on pivot points: 55,001, 54,836, and 54,570
Resistance based on Fibonacci retracement: 56,307, 58,648
Support based on Fibonacci retracement: 54,117, 52,891
Special Formation: The Bank Nifty formed a Doji-like candlestick pattern on the daily charts, indicating indecision among bulls and bears. On the weekly timeframe, a bullish candle with a long upper shadow was observed, signaling pressure at higher levels. However, the index traded above all key moving averages on both daily and weekly scales. The RSI remained above 60, at 67.16, but showed a negative crossover. The MACD maintained a positive crossover but trended downward.
3) Nifty Call Options Data
According to the weekly options data, the 25,000 strike holds the maximum Call open interest (with 1 crore contracts). This level can act as a key resistance for the Nifty in the short term. It was followed by the 24,500 strike (73.64 lakh contracts), and the 24,800 strike (59.04 lakh contracts).
Maximum Call writing was observed at the 25,000 strike, which saw an addition of 52.78 lakh contracts, followed by the 24,500 and 24,600 strikes, which added 47.11 lakh and 31.34 lakh contracts, respectively. The maximum Call unwinding was seen at the 24,000 strike, which shed 97,425 contracts, followed by the 24,100 and 23,900 strikes, which shed 81,525 and 59,475 contracts, respectively.
4) Nifty Put Options Data
On the Put side, the maximum Put open interest was seen at the 24,000 strike (with 68.01 lakh contracts), which can act as a key support level for the Nifty. It was followed by the 23,500 strike (51.54 lakh contracts) and the 24,300 strike (47.81 lakh contracts).
The maximum Put writing was placed at the 24,000 strike, which saw an addition of 22.59 lakh contracts, followed by the 24,300 and 23,500 strikes, which added 18.03 lakh and 17.47 lakh contracts, respectively. The Put unwinding was seen at the 25,200 strike, which shed 3,750 contracts, followed by the 25,150 strike which shed 1,200 contracts.
5) Bank Nifty Call Options Data
According to the monthly options data, the 55,500 strike holds the maximum Call open interest, with 10.65 lakh contracts. This can act as a key resistance level for the index in the short term. It was followed by the 56,000 strike (8.43 lakh contracts) and the 57,000 strike (7.98 lakh contracts).
Maximum Call writing was visible at the 56,000 strike (with the addition of 36,480 contracts), followed by the 55,900 strike (25,200 contracts) and the 56,400 strike (18,570 contracts). The maximum Call unwinding was seen at the 57,000 strike, which shed 63,570 contracts, followed by the 55,000 and 54,500 strikes, which shed 28,080 and 14,520 contracts, respectively.
6) Bank Nifty Put Options Data
On the Put side, the maximum Put open interest was seen at the 54,000 strike (with 11.57 lakh contracts), which can act as a key support level for the index. This was followed by the 55,000 strike (9.43 lakh contracts) and the 53,500 strike (9.29 lakh contracts).
The maximum Put writing was observed at the 53,500 strike (which added 84,930 contracts), followed by the 55,100 strike (47,100 contracts) and the 54,000 strike (44,550 contracts). The maximum Put unwinding was seen at the 55,400 strike, which shed 14,790 contracts, followed by the 55,800 and 54,900 strikes, which shed 11,820 and 10,170 contracts, respectively.
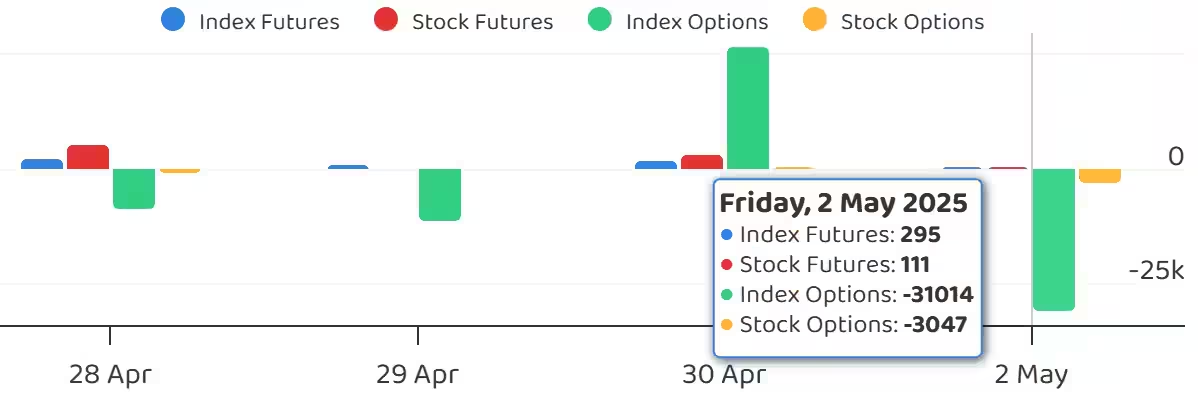
7) Funds Flow (Rs crore)
8) Put-Call Ratio
The Nifty Put-Call ratio (PCR), which indicates the mood of the market, dropped sharply to 0.91 on May 2, from 1.16 in the previous session.
The increasing PCR, or being higher than 0.7 or surpassing 1, means traders are selling more Put options than Call options, which generally indicates the firming up of a bullish sentiment in the market. If the ratio falls below 0.7 or moves towards 0.5, then it indicates selling in Calls is higher than selling in Puts, reflecting a bearish mood in the market.
9) India VIX
India VIX, the fear gauge, remained elevated above the 18 mark, closing at 18.26 on May 2—up 0.19 percent. It continued to sustain well above all moving averages, signaling further caution for bulls.
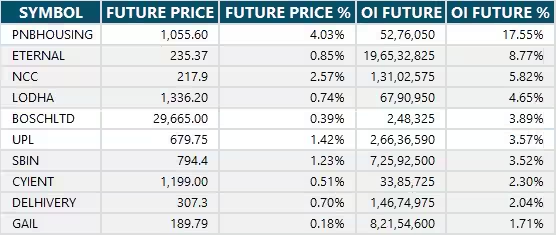
10) Long Build-up (35 Stocks)
A long build-up was seen in 35 stocks. An increase in open interest (OI) and price indicates a build-up of long positions.
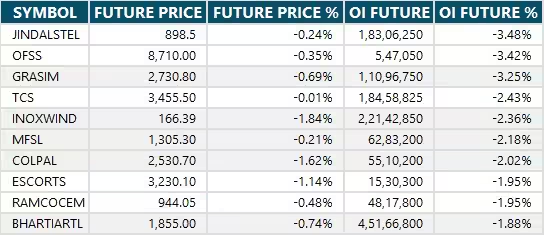
11) Long Unwinding (51 Stocks)
51 stocks saw a decline in open interest (OI) along with a fall in price, indicating long unwinding.
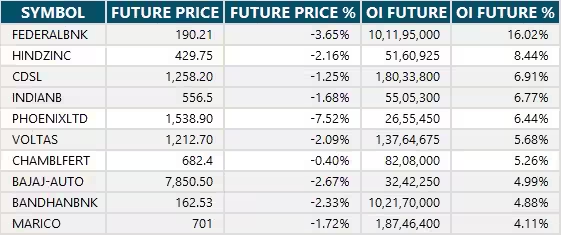
12) Short Build-up (88 Stocks)
88 stocks saw an increase in OI along with a fall in price, indicating a build-up of short positions.
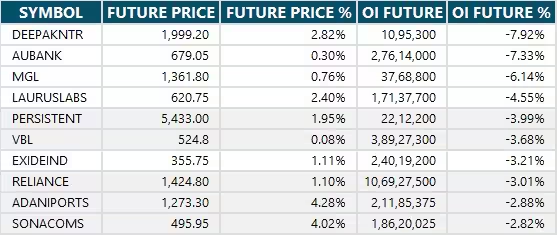
13) Short-Covering (47 Stocks)
47 stocks saw short-covering, meaning a decrease in OI, along with a price increase.
14) High Delivery Trades
Here are the stocks that saw a high share of delivery trades. A high share of delivery reflects investing (as opposed to trading) interest in a stock.

15) Stocks Under F&O Ban
Securities banned under the F&O segment include companies where derivative contracts cross 95 percent of the market-wide position limit.
Stocks added to F&O ban: Nil
Stocks retained in F&O ban: RBL Bank
Stocks removed from F&O ban: Nil


0 Comment