03 Oct , 2025 By : Debdeep Gupta

The Nifty 50 clocked a nearly 1 percent rally on October 1 as bulls ruled the market after an eight-day struggle, climbing back above the 100-day EMA (24,740). Sentiment definitely improved somewhat after the RBI policy announcement. However, the index needs to surpass and sustain above 25,000 (the midline of the Bollinger Bands and the 50 percent retracement of the recent fall) for a sharp upward journey. Until then, it may see consolidation and range-bound trading, with 24,600 acting as support — a level that has been defended in the previous three sessions, experts said.
Here are 15 data points we have collated to help you spot profitable trades:
1) Key Levels For The Nifty 50 (24,836)
Resistance based on pivot points: 24,870, 24,932, and 25,032
Support based on pivot points: 24,670, 24,608, and 24,508
Special Formation: The Nifty 50 formed a long bullish candle on the daily timeframe with above-average volumes. The index climbed above the 100-day EMA, but remains below the short- and medium-term moving averages. These moving averages have flattened after trending downward during the recent fall. The RSI jumped to 47.23, the Stochastic RSI showed a positive crossover, and the MACD still sustains a bearish crossover, but the histogram indicates that bearish momentum is fading. All this indicates a potential shift in momentum, but confirmation is still required with a move above key resistance levels.
2) Key Levels For The Bank Nifty (55,348)
Resistance based on pivot points: 55,427, 55,622, and 55,937
Support based on pivot points: 54,798, 54,603, and 54,288
Resistance based on Fibonacci retracement: 55,600, 56,080
Support based on Fibonacci retracement: 54,406, 53,406
Special Formation: The Bank Nifty staged a spectacular rally on Wednesday, forming a strong bullish candle on the daily charts with above-average volumes, and surpassing all key moving averages in a single session. The index also formed a higher high–higher low pattern for another session and reached close to a falling resistance trendline. The RSI and Stochastic RSI showed bullish crossovers, while the MACD also showed a positive crossover, with the histogram moving above the zero line. All this indicates strengthening bullish momentum and a potential breakout if the resistance trendline is crossed.
3) Nifty Call Options Data
According to the weekly options data, the 25,000 strike holds the maximum Call open interest (with 98.66 lakh contracts). This level can act as a key resistance for the Nifty in the short term. It was followed by the 25,500 strike (70.83 lakh contracts), and the 25,200 strike (53.12 lakh contracts).
Maximum Call writing was observed at the 25,000 strike, which saw an addition of 29.57 lakh contracts, followed by the 24,950 and 25,500 strikes, which added 27.97 lakh and 27.31 lakh contracts, respectively. The maximum Call unwinding was seen at the 24,700 strike, which shed 15.27 lakh contracts, followed by the 24,600 and 24,750 strikes, which shed 12.28 lakh and 1.43 lakh contracts, respectively.
4) Nifty Put Options Data
On the Put side, the maximum Put open interest was seen at the 24,700 strike (with 99.07 lakh contracts), which can act as a key support level for the Nifty. It was followed by the 24,600 strike (97.17 lakh contracts) and the 24,800 strike (81.46 lakh contracts).
The maximum Put writing was placed at the 24,800 strike, which saw an addition of 64 lakh contracts, followed by the 24,700 and 24,600 strikes, which added 63.72 lakh and 56.15 lakh contracts, respectively. The maximum Put unwinding was seen at the 25,200 strike, which shed 85,800 contracts, followed by the 25,300 and 25,500 strikes, which shed 30,450 and 21,075 contracts, respectively.
5) Bank Nifty Call Options Data
According to the monthly options data, the maximum Call open interest was placed at the 57,000 strike, with 20.66 lakh contracts. This can act as a key resistance level for the index in the short term. It was followed by the 56,000 strike (10.03 lakh contracts) and the 55,000 strike (9.09 lakh contracts).
Maximum Call writing was observed at the 55,500 strike (with the addition of 3.03 lakh contracts), followed by the 57,000 strike (2.34 lakh contracts), and the 57,500 strike (2.06 lakh contracts). The maximum Call unwinding was seen at the 54,700 strike, which shed 53,900 strike, followed by the 54,500 and 55,000 strikes, which shed 39,095 and 30,835 contracts, respectively.
6) Bank Nifty Put Options Data
On the Put side, the 55,000 strike holds the maximum Put open interest (with 13.67 lakh contracts), which can act as a key support level for the index. This was followed by the 54,000 strike (11.23 lakh contracts) and the 57,000 strike (10.61 lakh contracts).
The maximum Put writing was observed at the 55,000 strike (which added 5.66 lakh contracts), followed by the 55,500 strike (3.62 lakh contracts) and the 54,000 strike (2.53 lakh contracts). There was hardly any Put winding seen in the 53,750-57,500 strike band.
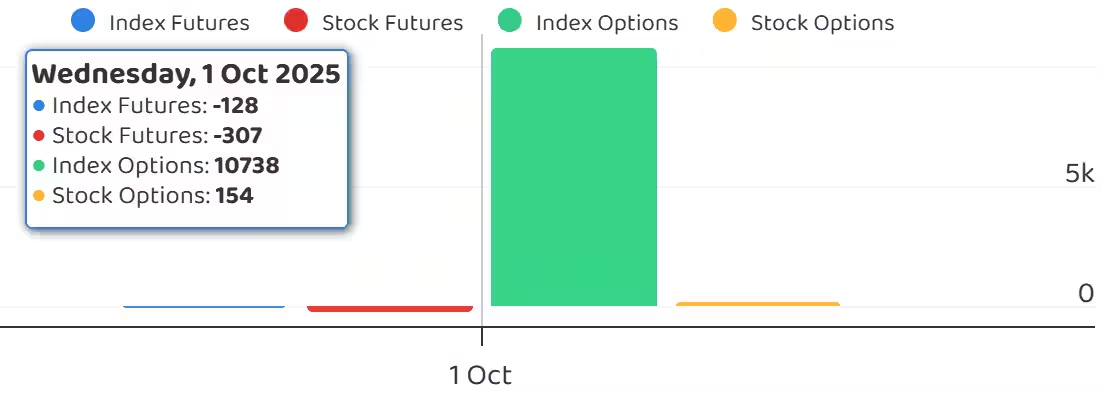
7) Funds Flow (Rs crore)
8) Put-Call Ratio
The Nifty Put-Call ratio (PCR), which indicates the mood of the market, jumped to 1.18 on October 01, compared to 0.91 in the previous session.
The increasing PCR, or being higher than 0.7 or surpassing 1, means traders are selling more Put options than Call options, which generally indicates the firming up of a bullish sentiment in the market. If the ratio falls below 0.7 or moves towards 0.5, then it indicates selling in Calls is higher than selling in Puts, reflecting a bearish mood in the market.
9) India VIX
The India VIX fell sharply on Wednesday to 10.29, down 7.03 percent, and also dropped below all short-term moving averages, signaling comfort for bulls.
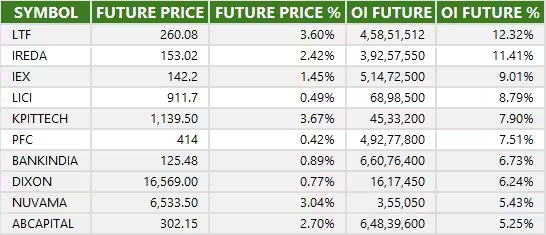
10) Long Build-up (121 Stocks)
A long build-up was seen in 121 stocks. An increase in open interest (OI) and price indicates a build-up of long positions.
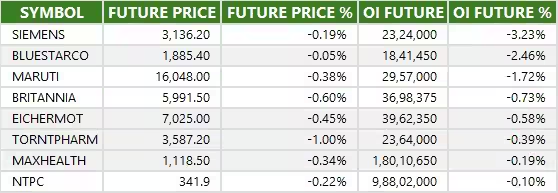
11) Long Unwinding (8 Stocks)
8 stocks saw a decline in open interest (OI) along with a fall in price, indicating long unwinding.
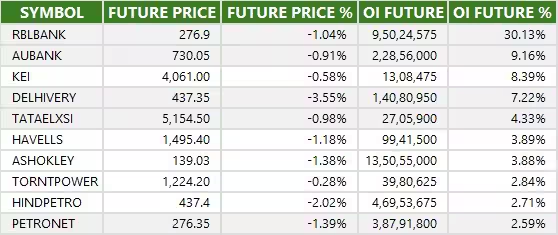
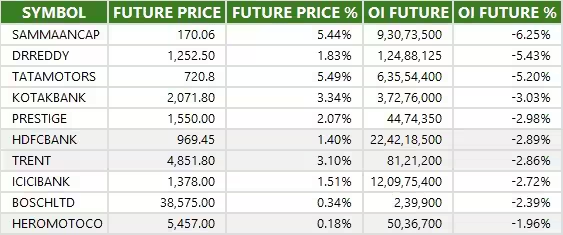
12) Short Build-up (37 Stocks)
37 stocks saw an increase in OI along with a fall in price, indicating a build-up of short positions.
13) Short-Covering (46 Stocks)
46 stocks saw short-covering, meaning a decrease in OI, along with a price increase.
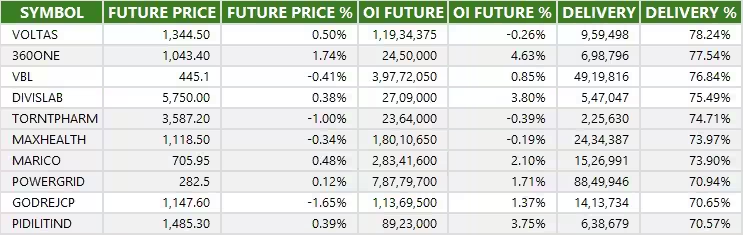
14) High Delivery Trades
Here are the stocks that saw a high share of delivery trades. A high share of delivery reflects investing (as opposed to trading) interest in a stock.
15) Stocks Under F&O Ban
Securities banned under the F&O segment include companies where derivative contracts cross 95 percent of the market-wide position limit.
Stocks added to F&O ban: RBL Bank
Stocks retained in F&O ban: Sammaan Capital
Stocks removed from F&O ban: Nil


0 Comment