19 Mar , 2025 By : Debdeep Gupta

The market staged a healthy performance on March 18, with the Nifty 50 decisively bridging the bearish gap of February 24 and closing 1.5 percent higher, driven by buying across sectors. The index also climbed well above the midline of the Bollinger bands, which is a positive sign. Hence, the overall trend appears to be positive in the short term. After a strong uptrend in the last two sessions, the benchmark index might see some consolidation with a support level of 22,720, according to experts. As long as this support holds, the upward journey toward 23,000-23,400 cannot be ruled out in the upcoming sessions.
Here are 15 data points we have collated to help you spot profitable trades:
1) Key Levels For The Nifty 50 (22,834)
Resistance based on pivot points: 22,863, 22,924, and 23,022
Support based on pivot points: 22,665, 22,604, and 22,505
Special Formation: The Nifty 50 formed a long bullish candlestick pattern on the daily charts, negating the lower high-lower low formation. Further, the index now trades above short-term moving averages (10 and 20-day EMAs) as well as above the midline of the Bollinger bands, which is a positive sign. The momentum indicator RSI (Relative Strength Index) climbed above the 50 mark to 54, while the MACD (Moving Average Convergence Divergence) maintained a positive bias, though it is still below the zero line.
2) Key Levels For The Bank Nifty (49,315)
Resistance based on pivot points: 49409, 49,591, and 49,886
Support based on pivot points: 48,820, 48,638, and 48,344
Resistance based on Fibonacci retracement: 50,283, 51,089
Support based on Fibonacci retracement: 47,883, 46,078
Special Formation: The Bank Nifty recorded a 2 percent gain and formed a long green candle on the daily timeframe after a positive opening, decisively moving back above the midline of the Bollinger bands as well as the 10, 20, and 50-day EMAs. It is now closer to the upper line of the Bollinger bands. The RSI showed a strong positive crossover, climbing above the 50 mark to 57.
3) Nifty Call Options Data
According to the weekly options data, the 23,000 strike holds the maximum Call open interest (with 1.32 crore contracts). This level can act as a key resistance for the Nifty in the short term. It was followed by the 23,500 strike (1.07 crore contracts), the 23,200 strike (79.51 lakh contracts), and 23,400 strike (76.98 lakh contracts).
Maximum Call writing was observed at the 23,000 strike, which saw an addition of 43.64 lakh contracts, followed by the 23,400 and 23,200 strikes, which added 25.04 lakh and 20.32 lakh contracts, respectively. The maximum Call unwinding was seen at the 22,700 strike, which shed 43.22 lakh contracts, followed by the 22,500 and 22,600 strikes, which shed 35.21 lakh and 26.11 lakh contracts, respectively.
4) Nifty Put Options Data
On the Put side, the maximum Put open interest was seen at the 22,500 strike (with 1.25 crore contracts), which can act as a key support level for the Nifty. It was followed by the 22,000 strike (1.21 crore contracts) and the 22,600 strike (1.04 crore contracts).
The maximum Put writing was placed at the 22,600 strike, which saw an addition of 78.26 lakh contracts, followed by the 22,700 and 22,800 strikes, which added 72.09 lakh and 57.48 lakh contracts, respectively. The maximum Put unwinding was seen at the 23,400 strike, which shed 2,325 contracts, followed by the 23,800 and 23,600 strikes, which shed 1,950 and 600 contracts, respectively.
5) Bank Nifty Call Options Data
According to the monthly options data, the maximum Call open interest was seen at the 49,000 strike, with 14.56 lakh contracts. This can act as a key level for the index in the short term. It was followed by the 51,000 strike (14.36 lakh contracts) and the 50,000 strike (13.22 lakh contracts).
Maximum Call writing was visible at the 49,200 strike (with the addition of 1.03 lakh contracts), followed by the 50,800 strike (82,380 contracts) and the 51,200 strike (79,890 contracts). The maximum Call unwinding was seen at the 48,500 strike, which shed 4.76 lakh contracts, followed by the 49,000 and 50,000 strikes, which shed 4.4 lakh and 2.51 lakh contracts, respectively.
6) Bank Nifty Put Options Data
On the Put side, the 49,000 strike holds the maximum Put open interest (with 19.79 lakh contracts), which can act as a key support level for the index. This was followed by the 48,000 strike (19.66 lakh contracts) and the 48,500 strike (12.2 lakh contracts).
The maximum Put writing was observed at the 49,000 strike (which added 10.77 lakh contracts), followed by the 48,000 strike (3.62 lakh contracts) and the 48,800 strike (3.43 lakh contracts). The maximum Put unwinding was seen at the 48,100 strike, which shed 22,770 contracts, followed by the 51,000 and 47,700 strikes which shed 21,570 and 19,320 contracts, respectively.
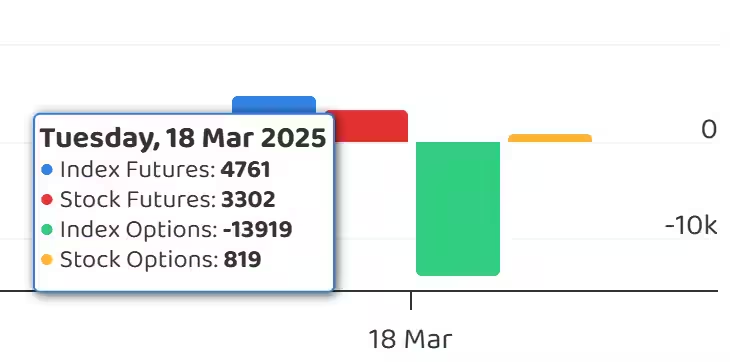
7) Funds Flow (Rs crore)
8) Put-Call Ratio
The Nifty Put-Call ratio (PCR), which indicates the mood of the market, jumped to 1.29 (for the first time since December 3, 2024) on March 18, against 1.05 in the previous session.
The increasing PCR, or being higher than 0.7 or surpassing 1, means traders are selling more Put options than Call options, which generally indicates the firming up of a bullish sentiment in the market. If the ratio falls below 0.7 or moves towards 0.5, then it indicates selling in Calls is higher than selling in Puts, reflecting a bearish mood in the market.
9) India VIX
The India VIX, the fear gauge that measures expected market volatility, dropped by 1.53 percent to 13.21 (the lowest level since December 24, 2024) and sustained below all key moving averages, further reassuring the bulls.
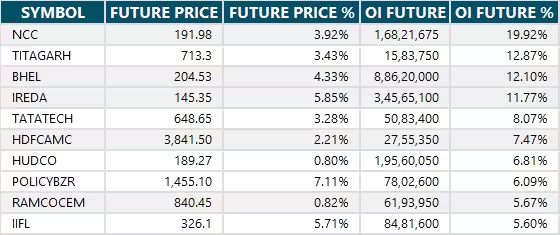
10) Long Build-up (108 Stocks)
A long build-up was seen in 108 stocks. An increase in open interest (OI) and price indicates a build-up of long positions.
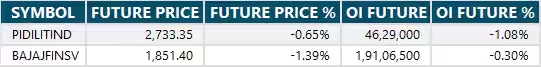
11) Long Unwinding (2 Stocks)
2 stocks saw a decline in open interest (OI) along with a fall in price, indicating long unwinding.
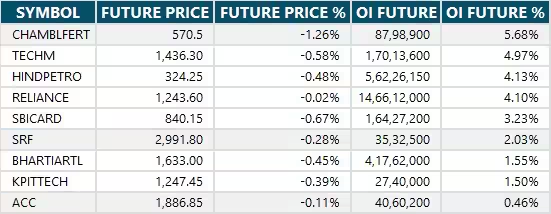
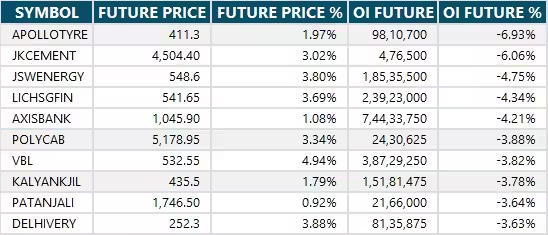
12) Short Build-up (9 Stocks)
9 stocks saw an increase in OI along with a fall in price, indicating a build-up of short positions.
13) Short-Covering (102 Stocks)
102 stocks saw short-covering, meaning a decrease in OI, along with a price increase.
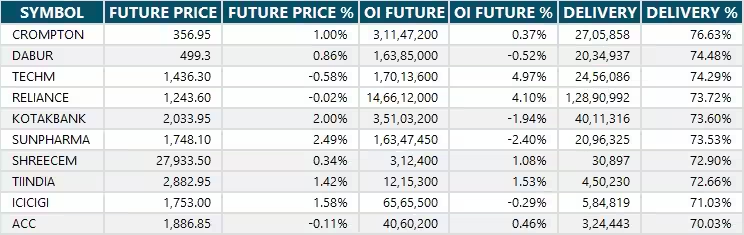
14) High Delivery Trades
Here are the stocks that saw a high share of delivery trades. A high share of delivery reflects investing (as opposed to trading) interest in a stock.
15) Stocks Under F&O Ban
Securities banned under the F&O segment include companies where derivative contracts cross 95 percent of the market-wide position limit.
Stocks retained in F&O ban: BSE, IndusInd Bank, Hindustan Copper, Manappuram Finance, SAIL
Stocks removed from F&O ban: Nil


0 Comment