01 Sep , 2025 By : Debdeep Gupta

The market corrected for the third consecutive session, falling 0.3 percent on August 29 and 1.8 percent for the week. Bearishness prevailed, driven by weakness in technical and momentum indicators, with the index trading below all key moving averages except the 200-day EMA. Hence, according to experts, if the index fails to defend the 24,400 zone in the upcoming session, a fall toward 24,330-24,270 (August low and 200-day EMA) can be seen. However, holding this zone could drive the index higher toward the 24,600–24,700 levels, followed by 24,800–25,000.
Here are 15 data points we have collated to help you spot profitable trades:
1) Key Levels For The Nifty 50 (24,427)
Resistance based on pivot points: 24,532, 24,572, and 24,636
Support based on pivot points: 24,404, 24,364, and 24,300
Special Formation: The Nifty 50 formed a bearish candle with a long upper shadow and a minor lower shadow on the daily charts, signaling selling pressure at higher levels. This somewhat resembles an Inverted Hammer candlestick pattern, typically a bullish reversal pattern in a downtrend — but confirmation from the following session is required. The index defended the rising support trendline on a closing basis, but traded below the 20, 50, and 100-day EMAs. The RSI dropped to 39.14 with a negative crossover, while the MACD gave a bearish crossover, with the histogram turning weaker. This indicates continued weakness in momentum.
2) Key Levels For The Bank Nifty (53,656)
Resistance based on pivot points: 53,966, 54,079, and 54,262
Support based on pivot points: 53,599, 53,486, and 53,303
Resistance based on Fibonacci retracement: 54,548, 55,138
Support based on Fibonacci retracement: 53,420, 52,422
Special Formation: The Bank Nifty formed a Doji candlestick pattern on the daily charts, indicating indecision among bulls and bears, while continuing the lower highs–lower lows structure and falling 0.3 percent. The index traded well below the 20, 50, and 100-day EMAs, all of which are trending downward. It is currently about 80 points away from the 200-day EMA (53,572) and 235 points away from the 50% Fibonacci retracement level (from April low to July high), both of which are crucial levels for further direction. The MACD stayed in a bearish crossover, and the histogram weakened further. This indicates continued bearish momentum, though the RSI, at 27.45, has already reached the oversold zone, hence, a rebound can't be ruled out, but sustainability is key.
3) Nifty Call Options Data
According to the weekly options data, the maximum Call open interest was seen at the 25,000 strike (with 1.65 crore contracts). This level can act as a key resistance for the Nifty in the short term. It was followed by the 24,600 strike (1.24 crore contracts), and the 24,500 strike (1.23 crore contracts).
Maximum Call writing was observed at the 24,500 strike, which saw an addition of 93.32 lakh contracts, followed by the 24,600 and 25,000 strikes, which added 80.71 lakh and 69.57 lakh contracts, respectively. There was hardly any Call unwinding seen in the 23,750-25,400 strike band.
4) Nifty Put Options Data
On the Put side, the 24,000 strike holds the maximum Put open interest (with 77.86 lakh contracts), which can act as a key support level for the Nifty. It was followed by the 24,400 strike (77.38 lakh contracts) and the 24,300 strike (56.7 lakh contracts).
The maximum Put writing was placed at the 24,400 strike, which saw an addition of 49.22 lakh contracts, followed by the 24,450 and 24,300 strikes, which added 22.16 lakh and 21.85 lakh contracts, respectively. The maximum Put unwinding was seen at the 24,800 strike, which shed 5 lakh contracts, followed by the 25,000 and 24,650 strikes, which shed 4.48 lakh and 2.79 lakh contracts, respectively.
5) Bank Nifty Call Options Data
According to the monthly options data, the 56,000 strike holds the maximum Call open interest, with 12.23 lakh contracts. This can act as a key resistance level for the index in the short term. It was followed by the 55,000 strike (10.56 lakh contracts) and the 54,000 strike (8.95 lakh contracts).
Maximum Call writing was observed at the 55,000 strike (with the addition of 2.67 lakh contracts), followed by the 54,000 strike (2.13 lakh contracts), and the 56,000 strike (1.99 lakh contracts). There was hardly any Call unwinding seen in the 52,100-56,000 strike band.
6) Bank Nifty Put Options Data
On the Put side, the maximum Put open interest was seen at the 54,000 strike (with 10.77 lakh contracts), which can act as a key level for the index. This was followed by the 53,000 strike (7.96 lakh contracts) and the 55,000 strike (7.1 lakh contracts).
The maximum Put writing was observed at the 52,500 strike (which added 1.67 lakh contracts), followed by the 54,000 strike (1 lakh contracts) and the 53,000 strike (83,545 contracts). The maximum Put winding was seen at the 54,700 strike, which shed 5,250 contracts, followed by the 54,900 and 55,200 strikes, which shed 1,470 and 1,400 contracts.
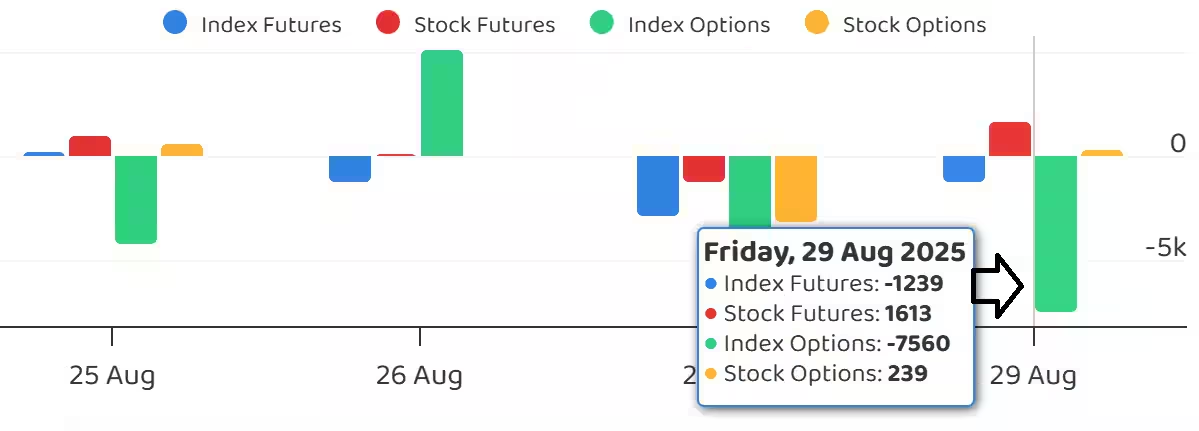
7) Funds Flow (Rs crore)
8) Put-Call Ratio
The Nifty Put-Call ratio (PCR), which indicates the mood of the market, fell to 0.71 on August 29, compared to 0.86 in the previous session.
The increasing PCR, or being higher than 0.7 or surpassing 1, means traders are selling more Put options than Call options, which generally indicates the firming up of a bullish sentiment in the market. If the ratio falls below 0.7 or moves towards 0.5, then it indicates selling in Calls is higher than selling in Puts, reflecting a bearish mood in the market.
9) India VIX
The India VIX, the fear index, dropped 3.49 percent on Friday to 11.75 and overall remained in the lower zone in a rangebound manner. Hence, market participants need to stay alert for any sharp market move on either side of the trade.
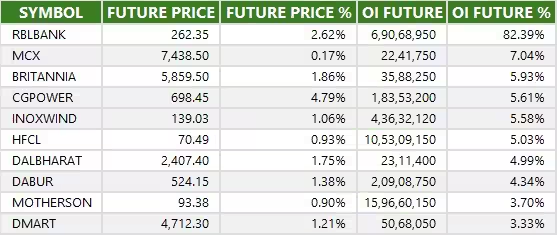
10) Long Build-up (45 Stocks)
A long build-up was seen in 45 stocks. An increase in open interest (OI) and price indicates a build-up of long positions.
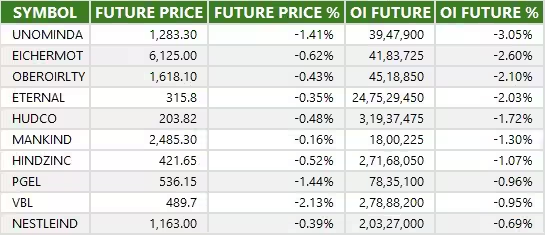
11) Long Unwinding (20 Stocks)
20 stocks saw a decline in open interest (OI) along with a fall in price, indicating long unwinding.
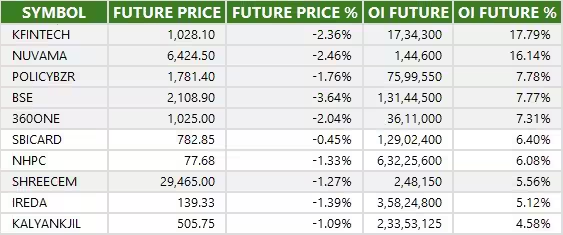
12) Short Build-up (116 Stocks)
116 stocks saw an increase in OI along with a fall in price, indicating a build-up of short positions.
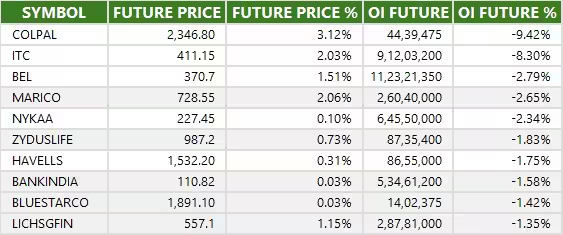
13) Short-Covering (29 Stocks)
29 stocks saw short-covering, meaning a decrease in OI, along with a price increase.
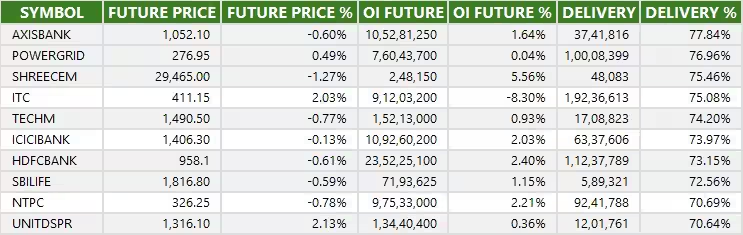
14) High Delivery Trades
Here are the stocks that saw a high share of delivery trades. A high share of delivery reflects investing (as opposed to trading) interest in a stock.
15) Stocks Under F&O Ban
Securities banned under the F&O segment include companies where derivative contracts cross 95 percent of the market-wide position limit.
Stocks added to F&O ban: Nil
Stocks retained in F&O ban: Nil
Stocks removed from F&O ban: Nil


0 Comment