16 May , 2025 By : Debdeep Gupta

The Nifty 50 hit a seven-month high as bulls were fully charged following a couple of days of consolidation, climbing above the 25,000 mark with a 1.6 percent rally on May 15. The index closed above the upper line of the Bollinger Bands, continuing the pattern of higher tops and higher bottoms, accompanied by above-average volumes—signaling strong market momentum. As a result, the index is expected to advance toward the 25,200–25,300 zone in the upcoming sessions, followed by the 25,500–25,700 range as the next potential target. On the downside, support is placed at 24,860 (the December 2024 swing high), followed by 24,500 as a crucial support level, according to experts.
Here are 15 data points we have collated to help you spot profitable trades:
1) Key Levels For The Nifty 50 (25,062)
Resistance based on pivot points: 25,128, 25,275, and 25,513
Support based on pivot points: 24,653, 24,507, and 24,269
Special Formation: The Nifty 50 formed a long bullish candlestick pattern on the daily chart and traded above all key moving averages. Both short-term (5, 10, and 20-day EMAs) and medium-term (50-day EMA) moving averages were trending northward, indicating a positive bias. The MACD (Moving Average Convergence and Divergence) showed a positive crossover with an improving histogram, while the RSI (Relative Strength Index) at 66.21 also gave a positive crossover, reinforcing the bullish sentiment.
2) Key Levels For The Bank Nifty (55,356)
Resistance based on pivot points: 55,497, 55,744, and 56,144
Support based on pivot points: 54,696, 54,448, and 54,048
Resistance based on Fibonacci retracement: 56,334, 58,681
Support based on Fibonacci retracement: 54,134, 52,912
Special Formation: The Bank Nifty rallied 1 percent and also formed a bullish candlestick pattern with a lower shadow on the daily timeframe, indicating strength. However, the volume was lower compared to the past few sessions. The index traded well above all key moving averages, suggesting that the overall trend remains positive. Meanwhile, there was a contraction in the Bollinger Bands, indicating that a significant move could be on the horizon. The index has been trading in a 1,000-point range over the last four sessions, and a breakout from this range is needed to determine the next directional move. The RSI at 62.64 was inclined upward, supporting bullish momentum. However, while the MACD continued to trade above the zero line, it showed a negative crossover with moderate weakness in the histogram, hinting at some caution.
3) Nifty Call Options Data
According to the weekly options data, the maximum Call open interest was seen at the 26,000 strike (with 88.55 lakh contracts). This level can act as a key resistance for the Nifty in the short term. It was followed by the 25,500 strike (44.64 lakh contracts), and the 25,000 strike (36.22 lakh contracts).
Maximum Call writing was observed at the 26,000 strike, which saw an addition of 43.02 lakh contracts, followed by the 25,100 and 25,500 strikes, which added 22.63 lakh and 19.88 lakh contracts, respectively. The maximum Call unwinding was seen at the 24,700 strike, which shed 2.86 lakh contracts, followed by the 24,750 and 24,650 strikes, which shed 1.55 lakh and 1.22 lakh contracts, respectively.
4) Nifty Put Options Data
On the Put side, the 24,500 strike holds the maximum Put open interest (with 42.36 lakh contracts), which can act as a key support level for the Nifty. It was followed by the 25,000 strike (39.98 lakh contracts) and the 24,600 strike (28.6 lakh contracts).
The maximum Put writing was placed at the 25,000 strike, which saw an addition of 34.89 lakh contracts, followed by the 24,500 and 24,800 strikes, which added 28.24 lakh and 21.32 lakh contracts, respectively. The Put unwinding was seen at the 24,150 strike, which shed 1.8 lakh contracts, followed by the 26,050 strike which shed 450 contracts.
5) Bank Nifty Call Options Data
According to the monthly options data, the maximum Call open interest was seen at the 56,000 strike, with 11.74 lakh contracts. This can act as a key resistance level for the index in the short term. It was followed by the 55,500 strike (11.63 lakh contracts) and the 57,000 strike (10.01 lakh contracts).
Maximum Call writing was visible at the 55,400 strike (with the addition of 75,360 contracts), followed by the 55,300 strike (28,920 contracts), the 55,900 and 55,600 strikes (13,200 contracts each). The maximum Call unwinding was seen at the 55,000 strike, which shed 1.98 lakh contracts, followed by the 57,000 and 56,500 strikes, which shed 1.71 lakh and 1.09 lakh contracts, respectively.
6) Bank Nifty Put Options Data
On the Put side, the 55,000 strike holds the maximum Put open interest (with 19.02 lakh contracts), which can act as a key support level for the index. This was followed by the 54,000 strike (12.44 lakh contracts) and the 55,500 strike (7.54 lakh contracts).
The maximum Put writing was observed at the 54,000 strike (which added 1.65 lakh contracts), followed by the 55,000 strike (1.45 lakh contracts) and the 55,400 strike (1.19 lakh contracts). The maximum Put unwinding was seen at the 54,200 strike, which shed 22,620 contracts, followed by the 56,500 and 53,700 strikes, which shed 13,620 and 630 contracts, respectively.
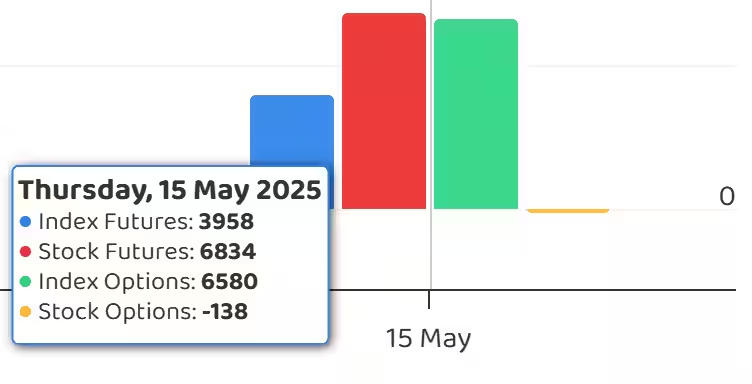
7) Funds Flow (Rs crore)
8) Put-Call Ratio
The Nifty Put-Call ratio (PCR), which indicates the mood of the market, jumped to 1.19 on May 15, from 0.89 in the previous session.
The increasing PCR, or being higher than 0.7 or surpassing 1, means traders are selling more Put options than Call options, which generally indicates the firming up of a bullish sentiment in the market. If the ratio falls below 0.7 or moves towards 0.5, then it indicates selling in Calls is higher than selling in Puts, reflecting a bearish mood in the market.
9) India VIX
The India VIX, the volatility index often referred to as the market's "fear gauge," fell for the fourth consecutive session, closing 1.93 percent lower at 16.89 levels. This decline in volatility further provided comfort to the bulls and supported the ongoing rally.
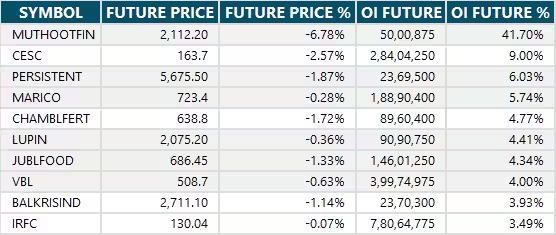
10) Long Build-up (90 Stocks)
A long build-up was seen in 90 stocks. An increase in open interest (OI) and price indicates a build-up of long positions.

11) Long Unwinding (19 Stocks)
19 stocks saw a decline in open interest (OI) along with a fall in price, indicating long unwinding.
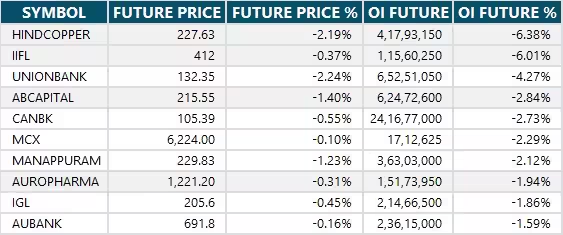
12) Short Build-up (23 Stocks)
23 stocks saw an increase in OI along with a fall in price, indicating a build-up of short positions.
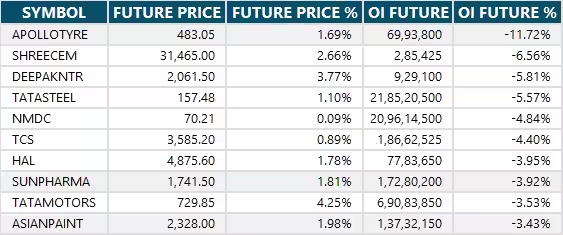
13) Short-Covering (85 Stocks)
85 stocks saw short-covering, meaning a decrease in OI, along with a price increase.
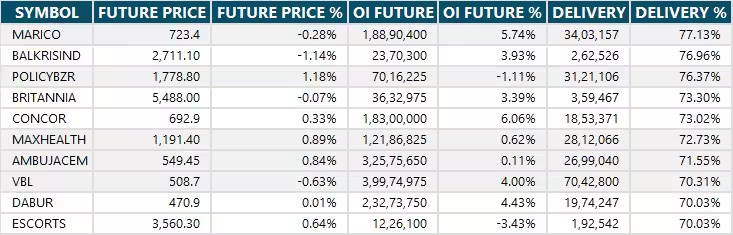
14) High Delivery Trades
Here are the stocks that saw a high share of delivery trades. A high share of delivery reflects investing (as opposed to trading) interest in a stock.
15) Stocks Under F&O Ban
Securities banned under the F&O segment include companies where derivative contracts cross 95 percent of the market-wide position limit.
Stocks added to F&O ban: Nil
Stocks retained in F&O ban: Central Depository Services, Hindustan Copper, Manappuram Finance
Stocks removed from F&O ban: Nil


0 Comment