14 Feb , 2025 By : Debdeep Gupta

The market failed to sustain its intraday rally due to a lack of strength at higher levels, and there was also a death crossover (the 50-day EMA falling below the 200-day EMA), signaling the strong position of bears at Dalal Street. Experts believe it remains a 'sell on rally' market. The index continued its downtrend for the seventh consecutive session. Therefore, if the index decisively breaches 23,000 on a closing basis, the 22,800-22,600 range (Wednesday's low and the low of June 6, 2024) cannot be ruled out in the upcoming sessions. However, in case of a bounce back, 23,250-23,350 will act as an immediate hurdle zone for the index.
Here are 15 data points we have collated to help you spot profitable trades:
1) Key Levels For The Nifty 50 (23,031)
Resistance based on pivot points: 23,179, 23,237, and 23,330
Support based on pivot points: 22,993, 22,936, and 22,843
Special Formation: The Nifty 50 formed a small-bodied bearish candlestick pattern with a long upper shadow on the daily charts, indicating a lack of strength at higher levels. The index remained not only below all key moving averages (10, 20, 50, 100, and 200-day EMAs) but also in the lower band of Bollinger Bands. Furthermore, the momentum indicators, with RSI (Relative Strength Index) at 40.17, stayed in the lower band, and MACD (Moving Average Convergence Divergence) was below the zero line with a negative crossover, signaling further negativity.
2) Key Levels For The Bank Nifty (49,360)
Resistance based on pivot points: 49,705, 49,837, and 50,051
Support based on pivot points: 49,277, 49,145, and 48,931
Resistance based on Fibonacci retracement: 50,378, 51,161
Support based on Fibonacci retracement: 49,276, 47,876
Special Formation: The Bank Nifty also reported a bearish candlestick pattern with a long upper wick on the daily timeframe, indicating selling pressure at higher levels. The momentum indicators RSI remained in the lower band, and MACD stayed below the zero line. Additionally, the index traded well below all key moving averages. However, it has consistently defended the midline of Bollinger Bands for the past three straight sessions and the 50% Fibonacci retracement (of the recent rally from 47,844 to 50,642), which is a bit of positive news, though the overall sentiment is still in favour of the bears.
3) Nifty Call Options Data
According to the weekly options data, the maximum Call open interest was seen at the 24,000 strike (with 80.88 lakh contracts). This level can act as a key resistance for the Nifty in the short term. It was followed by the 23,500 strike (42.7 lakh contracts) and the 23,400 strike (38 lakh contracts).
Maximum Call writing was observed at the 24,000 strike, which saw an addition of 55.13 lakh contracts, followed by the 23,400 and 23,200 strikes, which added 29.55 lakh and 25.04 lakh contracts, respectively. There was no major Call unwinding seen in the 22,200-24,100 strike band.
4) Nifty Put Options Data
On the Put side, the 22,400 strike holds the maximum Put open interest (with 33.53 lakh contracts), which can act as a key support level for the Nifty. It was followed by the 22,500 strike (32.28 lakh contracts) and the 22,200 strike (30.98 lakh contracts).
The maximum Put writing was placed at the 22,400 strike, which saw an addition of 28.19 lakh contracts, followed by the 22,200 and 22,300 strikes, which added 21.01 lakh and 17.49 lakh contracts, respectively. There was no major Put unwinding seen in the 22,200-24,100 strike band.
5) Bank Nifty Call Options Data
According to the monthly options data, the 51,000 strike holds the maximum Call open interest, with 16.08 lakh contracts. This can act as a key resistance level for the index in the short term. It was followed by the 50,000 strike (13.37 lakh contracts) and the 50,500 strike (9.6 lakh contracts).
Maximum Call writing was visible at the 49,500 strike (with the addition of 1.56 lakh contracts), followed by the 49,700 strike (1.38 lakh contracts) and the 49,800 strike (1.26 lakh contracts). The maximum Call unwinding was seen at the 51,000 strike, which shed 14,760 contracts, followed by the 48,000 and 51,100 strikes, which shed 9,630 and 7,110 contracts, respectively.
6) Bank Nifty Put Options Data
On the Put side, the maximum Put open interest was seen at the 49,000 strike (with 12.88 lakh contracts), which can act as a key support level for the index. This was followed by the 48,000 strike (11.56 lakh contracts) and the 50,000 strike (9.66 lakh contracts).
The maximum Put writing was observed at the 47,500 strike (which added 72,480 contracts), followed by the 49,500 strike (42,270 contracts) and the 49,600 strike (30,360 contracts). The maximum Put unwinding was seen at the 49,000 strike, which shed 78,450 contracts, followed by the 48,000 strike which shed 30,960 contracts.
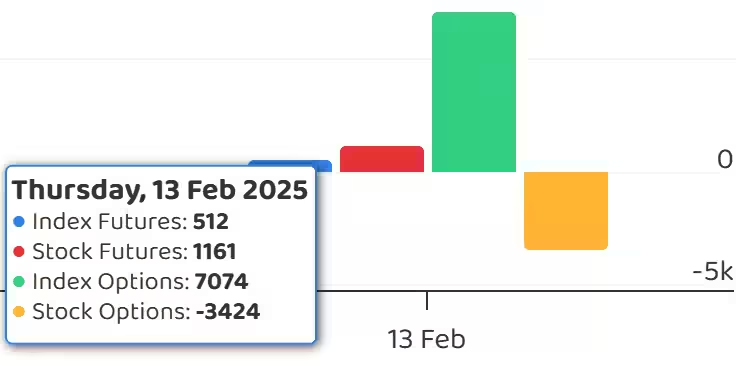
7) Funds Flow (Rs crore)
8) Put-Call Ratio
The Nifty Put-Call ratio (PCR), which indicates the mood of the market, rose further to 0.9 on February 13, against 0.75 in the previous session.
The increasing PCR, or being higher than 0.7 or surpassing 1, means traders are selling more Put options than Call options, which generally indicates the firming up of a bullish sentiment in the market. If the ratio falls below 0.7 or moves towards 0.5, then it indicates selling in Calls is higher than selling in Puts, reflecting a bearish mood in the market.
9) India VIX
The India VIX, a measure of expected market volatility, extended its upward journey for the fourth consecutive session, rising by 0.4 percent to 14.96, keeping the bulls cautious.
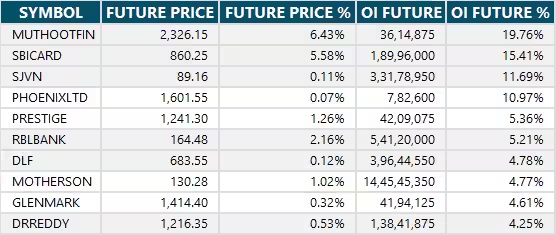
10) Long Build-up (52 Stocks)
A long build-up was seen in 52 stocks. An increase in open interest (OI) and price indicates a build-up of long positions.
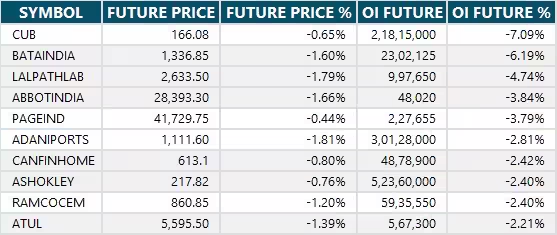
11) Long Unwinding (40 Stocks)
40 stocks saw a decline in open interest (OI) along with a fall in price, indicating long unwinding.
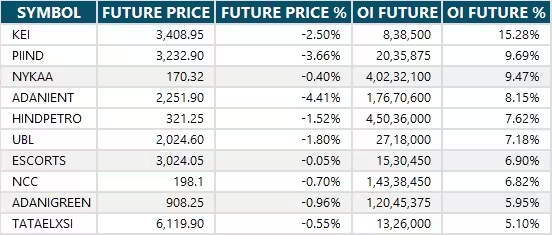
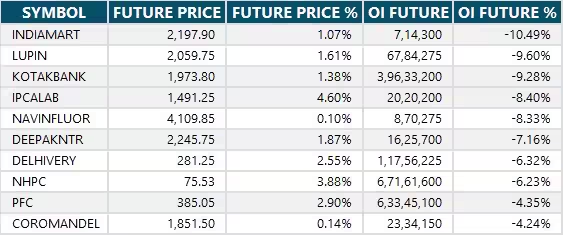
12) Short Build-up (76 Stocks)
76 stocks saw an increase in OI along with a fall in price, indicating a build-up of short positions.
13) Short-Covering (62 Stocks)
62 stocks saw short-covering, meaning a decrease in OI, along with a price increase.
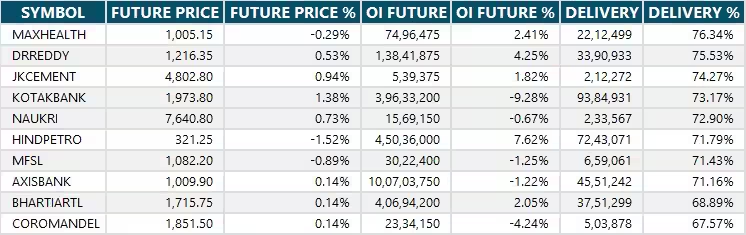
14) High Delivery Trades
Here are the stocks that saw a high share of delivery trades. A high share of delivery reflects investing (as opposed to trading) interest in a stock.
15) Stocks Under F&O Ban
Securities banned under the F&O segment include companies where derivative contracts cross 95 percent of the market-wide position limit.
Stocks added to F&O ban: Nil
Stocks retained in F&O ban: Manappuram Finance
Stocks removed from F&O ban: Nil


0 Comment