27 Dec , 2024 By : Debdeep Gupta

The Nifty 50 closed the rangebound trade on a flat note, rising 0.1 percent on December 26, the expiry session for monthly Futures & Options contracts. The upside has been capped at the 23,850 level (which coincides with the 200-day SMA) and the downside at the 23,650-23,700 zone (which somewhat coincides with the 200-day EMA) for the third consecutive session. The breaking of this trading range on either side can give firm direction to the index, with 24,000 being the next target on the higher side and 23,500 being the support on the lower side, experts said.
Here are 15 data points we have collated to help you spot profitable trades:
1) Key Levels For The Nifty 50 (23,750)
Resistance based on pivot points: 23,830, 23,877, and 23,954
Support based on pivot points: 23,676, 23,629, and 23,552
Special Formation: The Nifty 50 continued to form an inside bar kind of pattern on the daily charts for the third straight session, indicating rangebound trading. The index remained below the 10, 20, 50, and 100-day EMAs (Exponential Moving Averages) (though it sustained a tad above the 200-day EMA), indicating bearish sentiment. The momentum indicator RSI (Relative Strength Index at 38.8) and MACD (Moving Average Convergence Divergence) falling below the zero line indicated negative bias.
2) Key Levels For The Bank Nifty (51,171)
Resistance based on pivot points: 51,589, 51,775, and 52,076
Support based on pivot points: 50,986, 50,800, and 50,499
Resistance based on Fibonacci retracement: 51,572, 52,133
Support based on Fibonacci retracement: 50,659, 49,787
Special Formation: The Bank Nifty formed a bearish candlestick pattern with sizeable upper and lower shadows on the daily charts, indicating volatility and being rangebound, though it made an attempt to cross the 100-day EMA intraday. Overall, the sentiment remains bearish given the index trading below 10, 20, 50, and 100-day EMAs. Also, the RSI (at 40) and MACD dropped further below the zero line, showing a negative bias.
3) Nifty Call Options Data
According to the weekly options data, the 24,000 strike holds the maximum Call open interest (with 46.92 lakh contracts). This level can act as a key resistance level for the Nifty in the short term. It was followed by the 25,000 strike (46.8 lakh contracts), and the 24,500 strike (43.73 lakh contracts).
Maximum Call writing was observed at the 25,000 strike, which saw an addition of 25.96 lakh contracts, followed by the 24,500 and 23,800 strikes, which added 23.64 lakh and 21.29 lakh contracts, respectively, while there was hardly any Call unwinding seen.
4) Nifty Put Options Data
On the Put side, the maximum open interest was seen at the 23,800 strike (with 45.26 lakh contracts), which can act as a key level for the Nifty. It was followed by the 23,000 strike (27.43 lakh contracts), and the 23,500 strike (27.2 lakh contracts).
The maximum Put writing was placed at the 23,800 strike, which saw an addition of 26.03 lakh contracts, followed by the 23,000, and 23,700 strikes, with 12.18 lakh, and 11.75 lakh contracts added, respectively, while there was hardly any Put unwinding seen.
5) Bank Nifty Call Options Data
According to the monthly options data, the 52,000 strike holds the maximum Call open interest, with 10.58 lakh contracts. This can act as a key resistance level for the index in the short term. It was followed by the 53,000 strike (10.35 lakh contracts) and the 51,500 strike (7.74 lakh contracts).
Maximum Call writing was visible at the 52,000 strike (with the addition of 3.79 lakh contracts), followed by the 52,500 strike (2.15 lakh contracts) and the 51,500 strike (2.02 lakh contracts), while there was hardly any Call unwinding seen.
6) Bank Nifty Put Options Data
On the Put side, the maximum open interest was seen at the 51,500 strike (with 8.12 lakh contracts), which can act as a key level for the index. This was followed by the 51,000 strike (7.51 lakh contracts) and the 50,000 strike (7.1 lakh contracts).
The maximum Put writing was observed at the 51,000 strike (which added 1.73 lakh contracts), followed by the 52,000 strike (1.62 lakh contracts) and the 51,500 strike (1.52 lakh contracts), while there was hardly any Put unwinding seen.
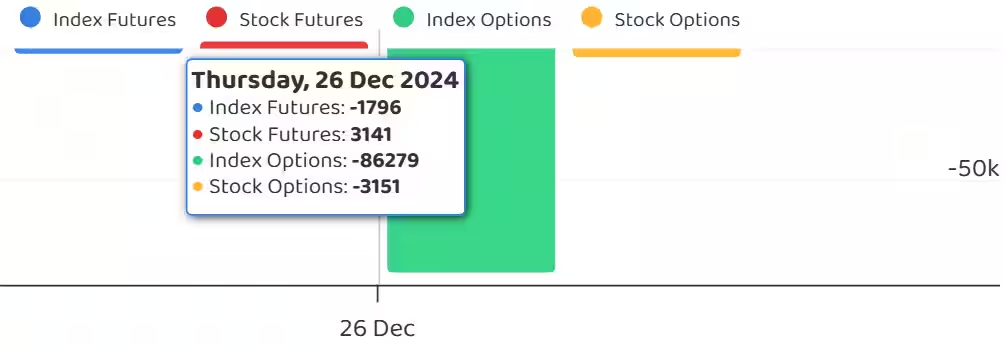
7) Funds Flow (Rs crore)
8) Put-Call Ratio
The Nifty Put-Call ratio (PCR), which indicates the mood of the market, dropped to 0.89 on December 26, from 0.94 level in the previous session.
The increasing PCR, or being higher than 0.7 or surpassing 1, means traders are selling more Put options than Call options, which generally indicates the firming up of a bullish sentiment in the market. If the ratio falls below 0.7 or moves towards 0.5, then it indicates selling in Calls is higher than selling in Puts, reflecting a bearish mood in the market.
9) India VIX
The India VIX, a fear indicator, snapped a two-day fall, rising 6.51 percent to the 14.03 level, which is still below the cautious level, hence there is still some comfort for bulls.
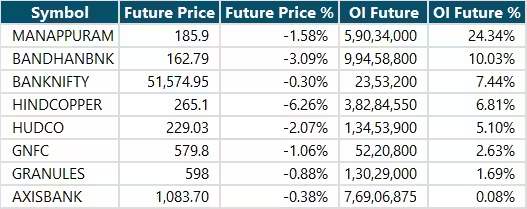
10) Long Build-up (1 Stock)
A long build-up was seen in 1 stock. An increase in open interest (OI) and price indicates a build-up of long positions.

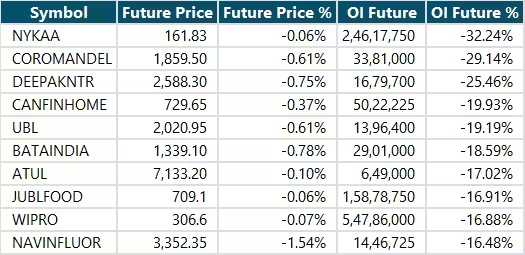
11) Long Unwinding (91 Stocks)
91 stocks saw a decline in open interest (OI) along with a fall in price, indicating long unwinding.
12) Short Build-up (8 Stocks)
8 stocks saw an increase in OI along with a fall in price, indicating a build-up of short positions.
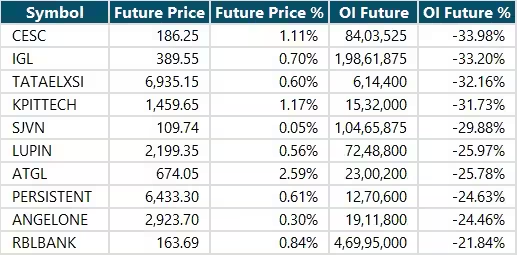
13) Short-Covering (127 Stocks)
127 stocks saw short-covering, meaning a decrease in OI, along with a price increase.
14) High Delivery Trades and High Rollovers
Here are the stocks that saw a high share of delivery trades. A high share of delivery reflects investing (as opposed to trading) interest in a stock.
Here are the stocks which saw the highest rollovers on expiry day.
15) Stocks Under F&O Ban
Securities banned under the F&O segment include companies where derivative contracts cross 95 percent of the market-wide position limit.
Stocks added to F&O ban: Nil
Stocks retained in F&O ban: Nil
Stocks removed from F&O ban: RBL Bank


0 Comment