09 Dec , 2024 By : Debdeep Gupta

Nifty Trade Setup
After five days of gains, the benchmark Nifty 50 closed the rangebound session with moderate losses on December 6, as market participants preferred to book some profits following the RBI outcome, which was in line with expectations. The index tested the 24,700 level (20-week SMA) and 24,800 (near the 50% Fibonacci retracement), which are expected to act as resistance levels for the index in the upcoming sessions. If these levels are surpassed, the 25,000 mark cannot be ruled out. On the downside, the immediate support zone is seen between 24,500 and 24,400 zones, with 24,200 being the next key support level, according to experts. Options data also reflects these levels.
Here are 15 data points we have collated to help you spot profitable trades:
1) Key Levels For The Nifty 50 (24,678)
Resistance based on pivot points: 24,733, 24,764, and 24,814
Support based on pivot points: 24,633, 24,602, and 24,553
Special Formation: The Nifty 50 traded within the previous day's range and formed a small red candle on the daily charts, while holding above all key moving averages and trading near the upper end of the Bollinger Bands. On the weekly timeframe, the index formed a long bullish candlestick pattern and continued its higher highs-higher lows formation for the second consecutive week, with above-average volumes, while trading above all key moving averages.
2) Key Levels For The Bank Nifty (53,510)
Resistance based on pivot points: 53,783, 53,950, and 54,221
Support based on pivot points: 53,243, 53,075, and 52,805
Resistance based on Fibonacci retracement: 54,467, 55,749
Support based on Fibonacci retracement: 52,480, 51,263
Special Formation: The Bank Nifty also traded within the previous day's range and formed a small bearish candlestick pattern with small upper shadows and long lower shadows on the daily charts, indicating volatility. The Bollinger Bands expanded on both sides, while the index traded above all key moving averages on both the daily and weekly timeframes, which is a positive sign. Additionally, the momentum indicator RSI (Relative Strength Index) showed a positive crossover during the week.
3) Nifty Call Options Data
According to the weekly options data, the maximum open interest was seen at the 25,500 strike (with 75.8 lakh contracts). This level can act as a key resistance level for the Nifty in the short term. It was followed by the 25,000 strike (71.87 lakh contracts), and the 24,700 strike (54.42 lakh contracts).
Maximum Call writing was observed at the 25,000 strike, which saw an addition of 41.57 lakh contracts, followed by the 25,500 and 24,700 strikes, which added 34.42 lakh and 33.49 lakh contracts, respectively, while the maximum Call unwinding was seen at the 24,100 strike, which shed 65,125 contracts, followed by the 24,500 and 24,400 strikes, which shed 30,075 and 19,325 contracts, respectively.
4) Nifty Put Options Data
On the Put side, the 24,000 strike saw the maximum open interest (with 55.93 lakh contracts), which can act as a key support level for the Nifty. It was followed by the 24,500 strike (49.73 lakh contracts), and the 24,200 strike (46.9 lakh contracts).
The maximum Put writing was placed at the 24,200 strike, which saw an addition of 31.4 lakh contracts, followed by the 24,700, and 24,000 strikes, with 25.5 lakh, and 25.2 lakh contracts added, respectively, while there was hardly any Put unwinding seen.
5) Bank Nifty Call Options Data
According to the monthly options data, the maximum Call open interest was seen at the 55,000 strike, with 18 lakh contracts. This can act as a key resistance level for the index in the short term. It was followed by the 54,000 strike (16.89 lakh contracts) and the 53,000 strike (12.82 lakh contracts).
Maximum Call writing was visible at the 55,000 strike (with the addition of 2.58 lakh contracts), followed by the 53,800 strike (1.95 lakh contracts) and the 54,500 strike (1.17 lakh contracts), while the maximum Call unwinding was seen at the 54,000 strike, which shed 64,605 contracts, followed by the 55,200 and 53,000 strikes, which shed 38,265 and 35,625 contracts, respectively.
6) Bank Nifty Put Options Data
On the Put side, the 52,000 strike holds the maximum open interest (with 17.64 lakh contracts), which can act as a key support level for the index. This was followed by the 52,500 strike (14.92 lakh contracts) and the 53,000 strike (12.76 lakh contracts).
The maximum Put writing was observed at the 53,800 strike (which added 1.86 lakh contracts), followed by the 53,500 strike (1.62 lakh contracts) and the 53,600 strike (93,660 contracts), while the maximum Put unwinding was seen at the 52,600 strike, which shed 32,205 contracts, followed by the 55,000 and 53,100 strikes, which shed 11,535 and 10,380 contracts, respectively.
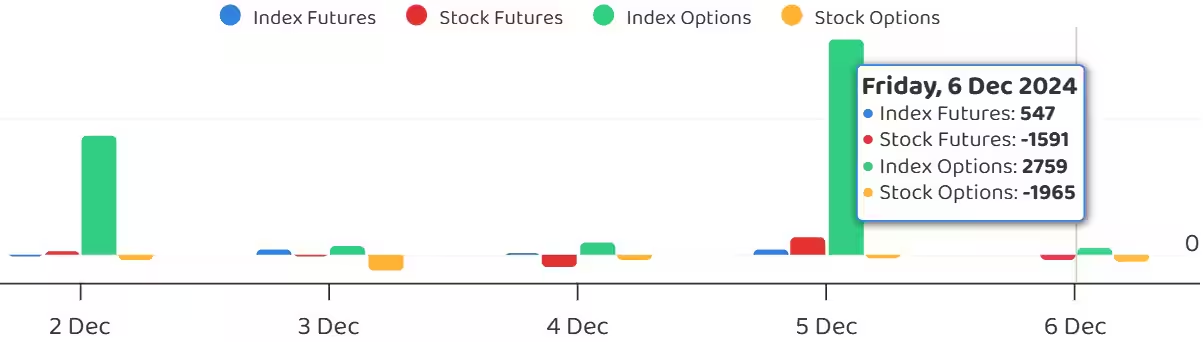
7) Funds Flow (Rs crore)
8) Put-Call Ratio
The Nifty Put-Call ratio (PCR), which indicates the mood of the market, fell to 1.03 on December 6, from 1.24 level in the previous session.
The increasing PCR, or being higher than 0.7 or surpassing 1, means traders are selling more Put options than Call options, which generally indicates the firming up of a bullish sentiment in the market. If the ratio falls below 0.7 or moves towards 0.5, then it indicates selling in Calls is higher than selling in Puts, reflecting a bearish mood in the market.
9) India VIX
The volatility index, the India VIX, fell below all key moving averages last Friday, providing comfort for bulls. The VIX closed at 14.14, down 2.67% from 14.53. Bulls may gain further confidence if the index continues to drop in the upcoming sessions.
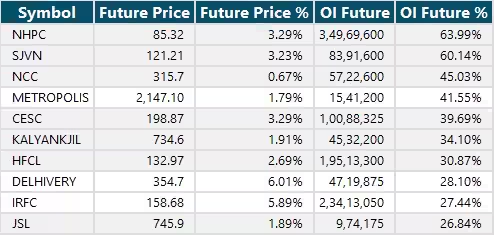
10) Long Build-up (87 Stocks)
A long build-up was seen in 87 stocks. An increase in open interest (OI) and price indicates a build-up of long positions.
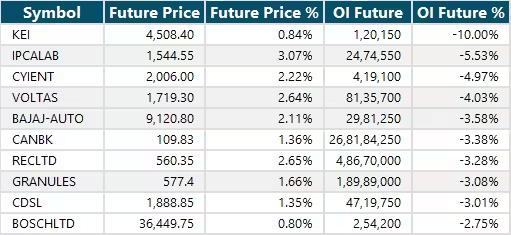
11) Long Unwinding (27 Stocks)
27 stocks saw a decline in open interest (OI) along with a fall in price, indicating long unwinding.
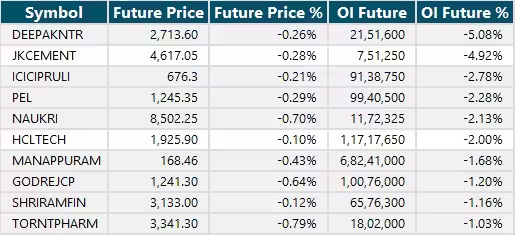
12) Short Build-up (61 Stocks)
61 stocks saw an increase in OI along with a fall in price, indicating a build-up of short positions.
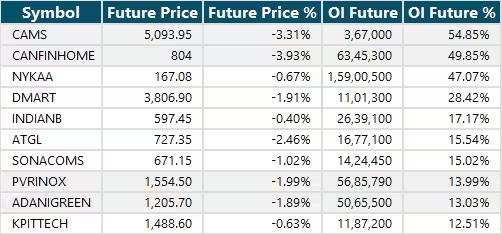
13) Short-Covering (49 Stocks)
49 stocks saw short-covering, meaning a decrease in OI, along with a price increase.
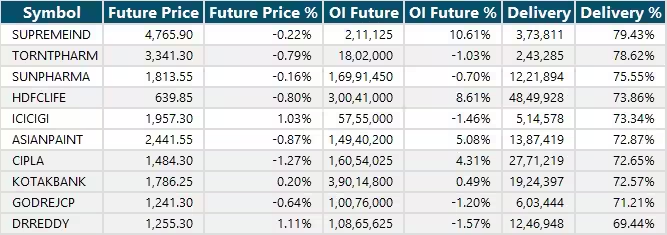
14) High Delivery Trades
Here are the stocks that saw a high share of delivery trades. A high share of delivery reflects investing (as opposed to trading) interest in a stock.
15) Stocks Under F&O Ban
Securities banned under the F&O segment include companies where derivative contracts cross 95 percent of the market-wide position limit.
Stocks added to F&O ban: PVR INOX, RBL Bank
Stocks retained in F&O ban: Granules India, Manappuram Finance
Stocks removed from F&O ban: Nil


0 Comment