Top companies

ASIANPAINT - 2439 (-0.5%) AXISBANK - 1171.6 (0.63%) BAJAJFINSV - 2012.6 (-1.31%) BAJFINANCE - 933 (-1.55%) BHARTIARTL - 1924.8 (-2.02%) BPCL - 344.3 (-1.89%) COALINDIA - 381.1 (-0.77%) HDFCBANK - 1983 (-1.16%) HEROMOTOCO - 4203 (-2.74%) HINDUNILVR - 2520 (4.63%) ICICIBANK - 1422 (-0.15%) INDUSINDBK - 858.3 (0.64%) ITC - 416.65 (-0.05%) KOTAKBANK - 2216 (0.55%) MARUTI - 12585 (-0.51%) ONGC - 241.65 (-0.59%) RELIANCE - 1495 (-1.46%) SBIN - 808.6 (0.07%) TATAMOTORS - 679 (-2.39%) TATASTEEL - 159.99 (-0.42%) TCS - 3264.5 (-3.47%) TITAN - 3361 (-1.72%) WIPRO - 258.1 (-2.62%)
TRENDING #BANK NIFTY 149 #ADANIPORTS 86 #ZOMATO 72

Trading Chart Patterns Every Trader Should Know in 2025

11 Jul , 2025   By : RAJIV DUTTA


Trading Chart Patterns Every Trader Should Know in 2025

Top 10 Trading Chart Patterns Every Trader Should Know in 2025

Introduction


In the world of stock trading, technical analysis is incomplete without understanding trading chart patterns. Whether you are a beginner or an experienced trader, recognizing these patterns can significantly improve your entry and exit strategies. In this post, we'll explore the top 10 most powerful chart patterns used by successful traders in 2025.
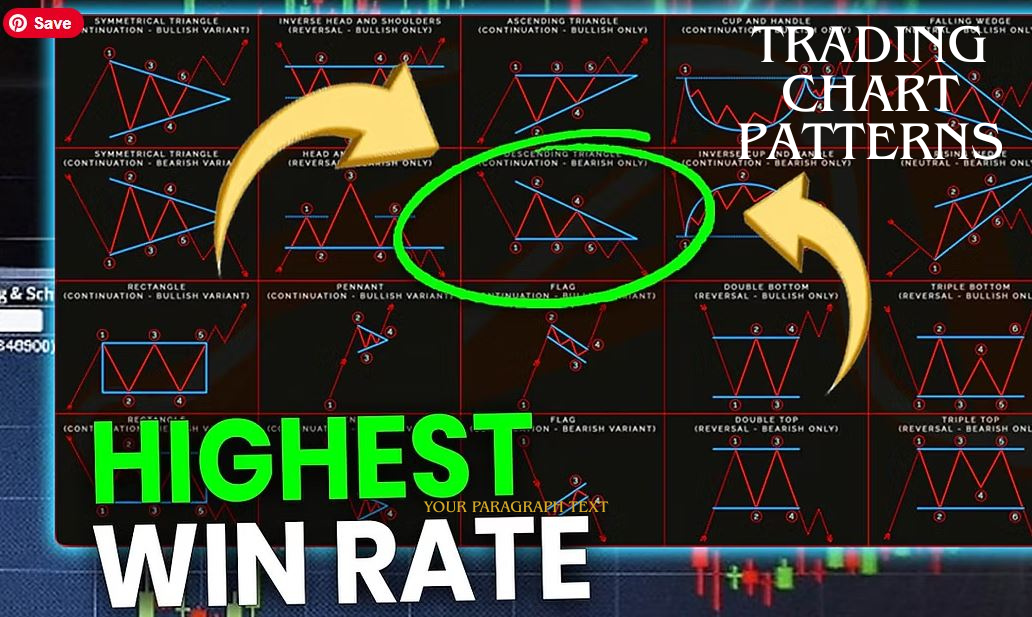

Top 10 Trading Chart Patterns You Must Know

1. Head and Shoulders


  • Type: Bearish Reversal
  • Indicates: End of an uptrend
  • Tip: Look for neckline break confirmation before entering a short position.


2. Double Top and Double Bottom

  • Double Top: Bearish reversal
  • Double Bottom: Bullish reversal
  • Best For: Spotting trend changes early


3. Cup and Handle

  • Type: Bullish Continuation
  • Ideal In: Long-term breakouts
  • Pro Tip: Wait for breakout above the handle resistance.


4. Ascending Triangle

  • Type: Bullish
  • Useful In: Breakout strategies
  • Features: Flat resistance line, rising support


5. Descending Triangle

  • Type: Bearish
  • Ideal For: Shorting setups
  • Pattern: Lower highs with horizontal support


6. Flag and Pennant Patterns

  • Type: Continuation
  • What It Means: A pause before the trend resumes
  • Timeframe: Best used in intraday and swing trades


7. Symmetrical Triangle

  • Type: Neutral to continuation
  • Breakout Direction: Depends on trend direction before triangle
  • Use With: Volume confirmation


8. Wedge Patterns (Rising/Falling)

  • Rising Wedge: Bearish
  • Falling Wedge: Bullish
  • Reliability: Medium, confirm with RSI or MACD


9. Rectangle Pattern

  • Type: Consolidation
  • Indicates: Market indecision
  • Tip: Trade breakouts with volume spike


10. Inverse Head and Shoulders

  • Type: Bullish Reversal
  • Strong Indicator: End of a downtrend
  • Entry Point: Breakout above neckline


Why Learn Trading Chart Patterns?

  • Improves accuracy in predicting market direction
  • Helps identify entry/exit points
  • Works across all markets — stocks, crypto, forex, commodities
  • Complements other tools like moving averages, RSI, MACD


Bonus Tips for Chart Pattern Trading

  • Always confirm with volume
  • Combine with candlestick patterns
  • Use stop-losses to manage risk
  • Backtest your strategy on past charts


Conclusion

Mastering trading chart patterns is essential for anyone serious about technical trading. While no pattern guarantees profits, they offer high-probability setups when used with confirmation indicators and strong risk management.

If you're just starting out, begin by learning the most common ones like Head and Shoulders, Triangles, and Flags. With practice and patience, these patterns can become your secret weapon in the stock market.


Want More?

Follow our Telegram channel for daily stock market tips, intraday signals, trading chart patterns, index option trading and live chart setups.


-> Join Dream Nifty - Free Stock Market Tips


0 Comment


LEAVE A COMMENT


Growmudra © 2025 all right reserved

Partner With Us