26 Aug , 2025 By : Debdeep Gupta

The Nifty 50 recouped some of Friday's losses, gaining 0.4 percent on August 25. The index held above the previous day's low and key moving averages, while forming an indecision pattern. According to experts, as long as the index stays above 24,850 (support), a gradual upside toward 25,000 (immediate hurdle) is possible, followed by a move toward the 25,150–25,250 resistance zone in the upcoming sessions. However, a decisive fall below the 24,850 support level could open the door for a decline toward 24,700, which is the midline of the Bollinger Bands.
Here are 15 data points we have collated to help you spot profitable trades:
1) Key Levels For The Nifty 50 (24,968)
Resistance based on pivot points: 25,010, 25,040, and 25,089
Support based on pivot points: 24,913, 24,883, and 24,834
Special Formation: The Nifty 50 formed a small bullish candle with upper and lower shadows within the previous day's long red candle on the daily chart. This pattern indicates protection of the prior day’s low and an absence of follow-through selling. The index also sustained above the 20-day and 50-day EMAs, while the RSI inched up to 53.48 with a positive crossover, suggesting strengthening momentum. Meanwhile, the MACD maintained a bullish crossover and moved closer to the zero line, with the histogram continuing to stay above the zero line. This indicates a positive short-term trend and a potential for further upside.
2) Key Levels For The Bank Nifty (55,139)
Resistance based on pivot points: 55,263, 55,324, and 55,422
Support based on pivot points: 55,066, 55,005, and 54,907
Resistance based on Fibonacci retracement: 55,548, 55,945
Support based on Fibonacci retracement: 54,392, 53,392
Special Formation: The Bank Nifty formed a Doji candlestick pattern on the daily timeframe, following a long bearish candle in the previous session, signaling indecision among bulls and bears. The index remained above the 100-day EMA (55,000) and the August low (54,900), but continued to trade well below the 20-day and 50-day EMAs, which is considered a negative technical signal. The RSI stood at 40.41, sustaining a bearish crossover, and the MACD was on the verge of a negative crossover below the zero line, with the histogram momentum fading further. This indicates weakening momentum and a potential downside bias unless the index stages a recovery above key resistance levels.
3) Nifty Call Options Data
According to the monthly options data, the 25,000 strike holds the maximum Call open interest (with 1.47 crore contracts). This level can act as a key resistance for the Nifty in the short term. It was followed by the 25,500 strike (1.09 crore contracts), and the 25,200 strike (1.03 crore contracts).
Maximum Call writing was observed at the 25,550 strike, which saw an addition of 18 lakh contracts, followed by the 25,400 and 25,450 strikes, which added 10.15 lakh and 8.34 lakh contracts, respectively. The maximum Call unwinding was seen at the 24,900 strike, which shed 32.92 lakh contracts, followed by the 25,000 and 25,700 strikes, which shed 26.6 lakh and 13.87 lakh contracts, respectively.
4) Nifty Put Options Data
On the Put side, the maximum Put open interest was seen at the 25,000 strike (with 1.09 crore contracts), which can act as a key level for the Nifty. It was followed by the 24,900 strike (90.21 lakh contracts) and the 24,500 strike (77.85 lakh contracts).
The maximum Put writing was placed at the 25,000 strike, which saw an addition of 36.25 lakh contracts, followed by the 24,950 and 24,900 strikes, which added 33.89 lakh and 25.72 lakh contracts, respectively. The maximum Put unwinding was seen at the 24,400 strike, which shed 5.13 lakh contracts, followed by the 24,450 and 25,100 strikes, which shed 3.06 lakh and 1.63 lakh contracts, respectively.
5) Bank Nifty Call Options Data
According to the monthly options data, the maximum Call open interest was seen at the 57,000 strike, with 27.25 lakh contracts. This can act as a key resistance level for the index in the short term. It was followed by the 56,000 strike (26.22 lakh contracts) and the 55,500 strike (21.96 lakh contracts).
Maximum Call writing was observed at the 55,500 strike (with the addition of 5.48 lakh contracts), followed by the 55,200 strike (3.76 lakh contracts), and the 55,300 strike (2.56 lakh contracts). The maximum Call unwinding was seen at the 54,000 strike, which shed 11,865 contracts, followed by the 57,100 and 56,100 strikes, which shed 7,105 contracts, and 5,250 contracts, respectively.
6) Bank Nifty Put Options Data
On the Put side, the 55,000 strike holds the maximum Put open interest (with 12.9 lakh contracts), which can act as a key support level for the index. This was followed by the 54,000 strike (10.34 lakh contracts) and the 57,000 strike (9.48 lakh contracts).
The maximum Put writing was observed at the 55,000 strike (which added 2.05 lakh contracts), followed by the 55,100 strike (2.04 lakh contracts) and the 55,200 strike (1.65 lakh contracts). The maximum Put unwinding was seen at the 57,000 strike, which shed 2.52 lakh contracts, followed by the 56,000 and 55,800 strikes, which shed 90,510 and 66,465 contracts, respectively.
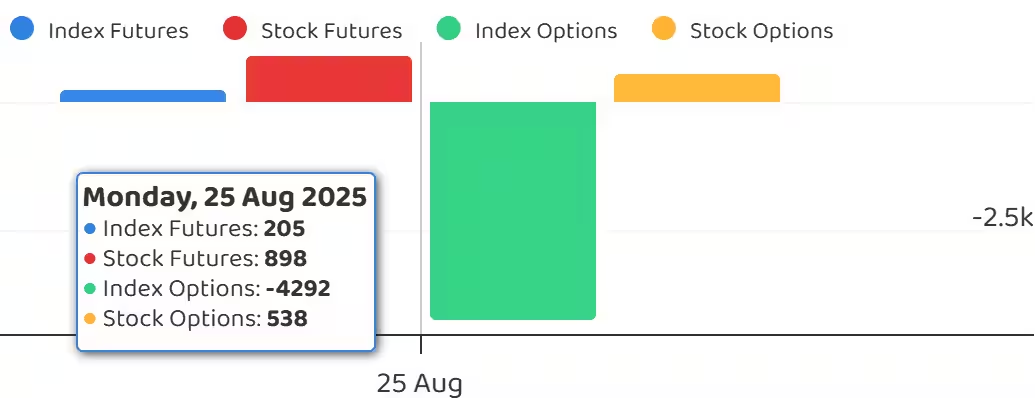
7) Funds Flow (Rs crore)
8) Put-Call Ratio
The Nifty Put-Call ratio (PCR), which indicates the mood of the market, climbed to 0.88 on August 25, compared to 0.73 in the previous session.
The increasing PCR, or being higher than 0.7 or surpassing 1, means traders are selling more Put options than Call options, which generally indicates the firming up of a bullish sentiment in the market. If the ratio falls below 0.7 or moves towards 0.5, then it indicates selling in Calls is higher than selling in Puts, reflecting a bearish mood in the market.
9) India VIX
The India VIX, which measures expected market volatility, rose 0.26 percent to 11.76. Despite the rise, it remained below all key moving averages, which is favourable for the bulls and suggests a relatively stable and less uncertain market environment.
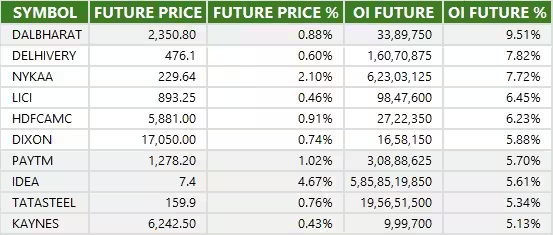
10) Long Build-up (72 Stocks)
A long build-up was seen in 72 stocks. An increase in open interest (OI) and price indicates a build-up of long positions.
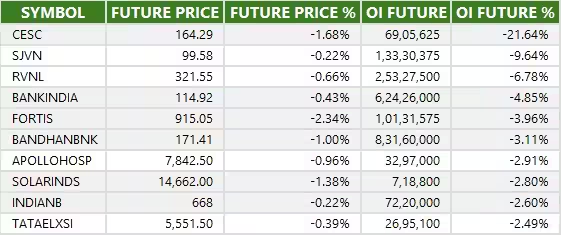
11) Long Unwinding (31 Stocks)
31 stocks saw a decline in open interest (OI) along with a fall in price, indicating long unwinding.
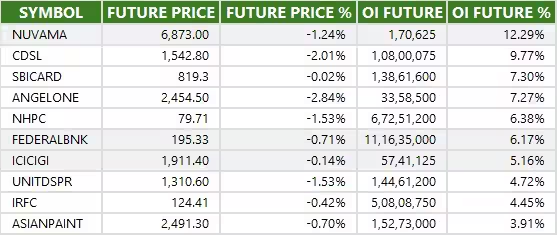
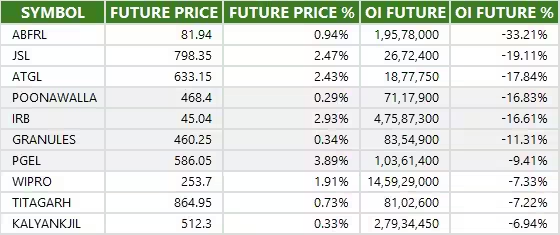
12) Short Build-up (56 Stocks)
56 stocks saw an increase in OI along with a fall in price, indicating a build-up of short positions.
13) Short-Covering (61 Stocks)
61 stocks saw short-covering, meaning a decrease in OI, along with a price increase.
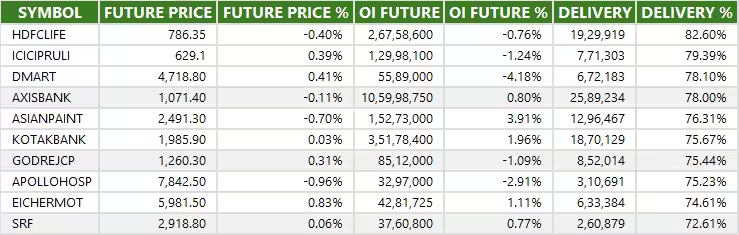
14) High Delivery Trades
Here are the stocks that saw a high share of delivery trades. A high share of delivery reflects investing (as opposed to trading) interest in a stock.
15) Stocks Under F&O Ban
Securities banned under the F&O segment include companies where derivative contracts cross 95 percent of the market-wide position limit.
Stocks added to F&O ban: Nil
Stocks retained in F&O ban: RBL Bank, Titagarh Rail Systems
Stocks removed from F&O ban: PG Electroplast


0 Comment