30 Jun , 2025 By : Debdeep Gupta

The Nifty 50 kicked off the July series on a positive note, gaining 0.35 percent and extending its upward journey for the fourth consecutive session to close at a fresh nine-month high on June 27. Sentiment turned favourable for bulls due to a sharp fall in the VIX, positive crossovers in momentum indicators, and easing tensions in the Middle East. According to experts, in the upcoming sessions, the index needs to clear the 25,750–25,800 hurdle for a strong move toward 26,000 and eventually a record high. Until then, some consolidation may be seen, with support in the 25,400–25,300 zone.
Here are 15 data points we have collated to help you spot profitable trades:
1) Key Levels For The Nifty 50 (25,638)
Resistance based on pivot points: 25,655, 25,686, and 25,736
Support based on pivot points: 25,555, 25,524, and 25,475
Special Formation: The Nifty 50 formed a bullish candle for the third consecutive session, continuing the higher-low formation for the sixth straight day. Traded volumes remained above average for another session. The index traded well above the upper band of the Bollinger Bands, with expansion in the bands. The MACD, Stochastic RSI, and RSI (at 67.72) sustained positive crossovers, with a continued positive bias in the histogram, signalling further uptrend in the Nifty 50.
2) Key Levels For The Bank Nifty (57,444)
Resistance based on pivot points: 57,488, 57,602, and 57,786
Support based on pivot points: 57,120, 57,007, and 56,823
Resistance based on Fibonacci retracement: 57,566, 58,224
Support based on Fibonacci retracement: 56,926, 56,587
Special Formation: The Bank Nifty reached a new high of 57,475 last Friday and closed above the upper line of the Bollinger Bands, accompanied by an expansion in the bands. The banking index formed a bullish candle with a lower shadow on the daily timeframe, while trading volume remained above average for another session. The RSI (at 67.31) and Stochastic RSI maintained positive crossovers, while the MACD stayed well above the zero line with a positive crossover and a healthy bias in the histogram.
3) Nifty Call Options Data
According to the weekly options data, the 26,500 strike holds the maximum Call open interest (with 79.4 lakh contracts). This level can act as a key resistance for the Nifty in the short term. It was followed by the 26,000 strike (77.43 lakh contracts), and the 25,900 strike (48.51 lakh contracts).
Maximum Call writing was observed at the 25,900 strike, which saw an addition of 32.87 lakh contracts, followed by the 26,000 and 25,700 strikes, which added 27.49 lakh and 20.47 lakh contracts, respectively. The maximum Call unwinding was seen at the 25,500 strike, which shed 10.94 lakh contracts, followed by the 25,400 and 25,300 strikes, which shed 7.49 lakh and 6.36 lakh contracts, respectively.
4) Nifty Put Options Data
On the Put side, the maximum Put open interest was observed at the 25,000 strike (with 88.63 lakh contracts), which can act as a key support level for the Nifty. It was followed by the 25,500 strike (87.69 lakh contracts) and the 25,400 strike (66.45 lakh contracts).
The maximum Put writing was placed at the 25,600 strike, which saw an addition of 49.78 lakh contracts, followed by the 25,500 and 25,000 strikes, which added 36.18 lakh and 30.38 lakh contracts, respectively. There was hardly any Put unwinding seen in the 24,800-26,750 strike band.
5) Bank Nifty Call Options Data
According to the monthly options data, the maximum Call open interest was seen at the 56,000 strike, with 14.26 lakh contracts. This can act as a key level for the index in the short term. It was followed by the 57,000 strike (7.85 lakh contracts) and the 59,000 strike (6.76 lakh contracts).
Maximum Call writing was visible at the 57,500 strike (with the addition of 1.54 lakh contracts), followed by the 59,000 strike (1.29 lakh contracts), and the 59,500 strike (1.26 lakh contracts). The maximum Call unwinding was seen at the 56,500 strike, which shed 18,865 contracts, followed by the 56,600 and 57,100 strikes, which shed 14,385 and 13,440 contracts, respectively.
6) Bank Nifty Put Options Data
On the Put side, the 56,000 strike holds the maximum Put open interest (with 19.93 lakh contracts), which can act as a key support level for the index. This was followed by the 57,000 strike (11.11 lakh contracts) and the 56,500 strike (5.12 lakh contracts).
The maximum Put writing was observed at the 57,000 strike (which added 2.56 lakh contracts), followed by the 57,500 strike (2.43 lakh contracts) and the 57,200 strike (1.53 lakh contracts). There was hardly any Put unwinding seen in the 55,700-59,600 strike band.
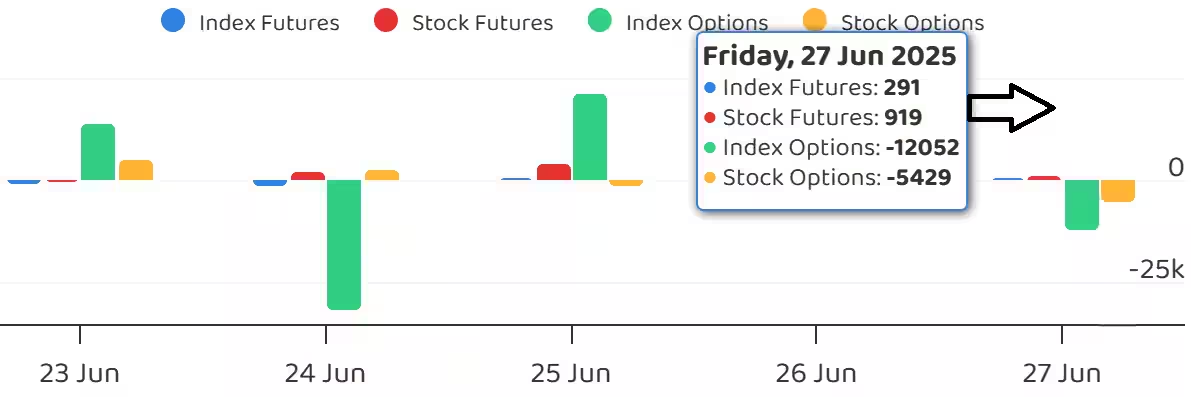
7) Funds Flow (Rs crore)
8) Put-Call Ratio
The Nifty Put-Call ratio (PCR), which indicates the mood of the market, fell to 1.25 on June 27, compared to 1.28 in the previous session.
The increasing PCR, or being higher than 0.7 or surpassing 1, means traders are selling more Put options than Call options, which generally indicates the firming up of a bullish sentiment in the market. If the ratio falls below 0.7 or moves towards 0.5, then it indicates selling in Calls is higher than selling in Puts, reflecting a bearish mood in the market.
9) India VIX
The fear index, India VIX, continued its downtrend for the fourth consecutive session, falling 1.61 percent to 12.39 — the lowest closing level since October 1, 2024 — a development that is now more favourable for the bulls.
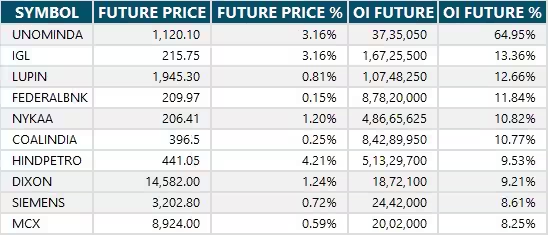
10) Long Build-up (80 Stocks)
A long build-up was seen in 80 stocks. An increase in open interest (OI) and price indicates a build-up of long positions.
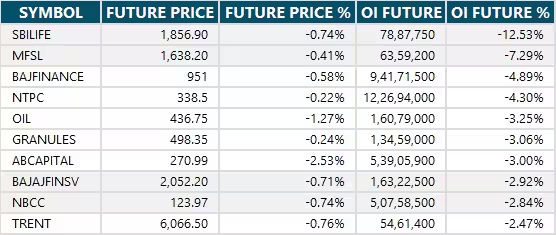
11) Long Unwinding (27 Stocks)
27 stocks saw a decline in open interest (OI) along with a fall in price, indicating long unwinding.
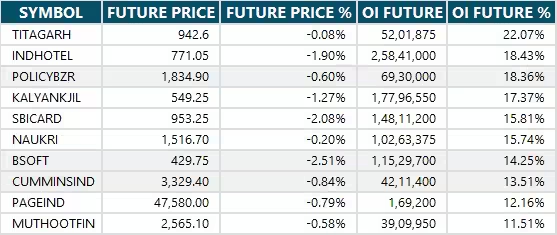
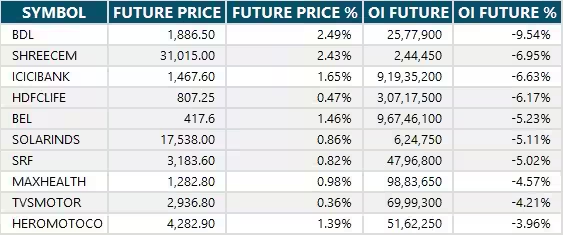
12) Short Build-up (68 Stocks)
68 stocks saw an increase in OI along with a fall in price, indicating a build-up of short positions.
13) Short-Covering (49 Stocks)
49 stocks saw short-covering, meaning a decrease in OI, along with a price increase.
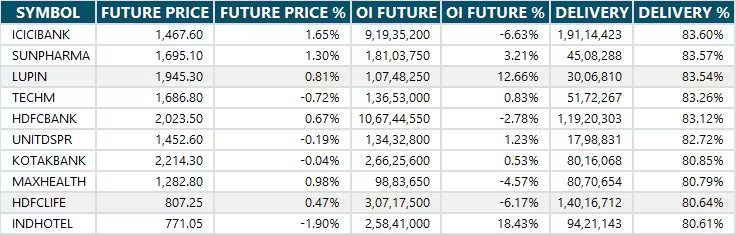
14) High Delivery Trades
Here are the stocks that saw a high share of delivery trades. A high share of delivery reflects investing (as opposed to trading) interest in a stock.
15) Stocks Under F&O Ban
Securities banned under the F&O segment include companies where derivative contracts cross 95 percent of the market-wide position limit.
Stocks added to F&O ban: Nil
Stocks retained in F&O ban: Nil
Stocks removed from F&O ban: Nil


0 Comment