05 Jun , 2025 By : Debdeep Gupta

The Nifty 50 bounced back after three days of weakness and closed above 24,600 (up 0.3 percent), near the 20-day EMA, on June 4, as the RBI began its three-day policy meeting. The easing India VIX also supported the positive sentiment. The index sustained above the lower end of the 24,500–25,000 range, which is expected to act as a key support zone in the upcoming sessions. However, it remained below the midline of the Bollinger Bands at 24,700. Hence, the immediate hurdle is expected at 24,700, and above that, 24,850 becomes the next level to watch. Conversely, a fall below 24,500 could bring bears into action mode, according to experts.
Here are 15 data points we have collated to help you spot profitable trades:
1) Key Levels For The Nifty 50 (24,620)
Resistance based on pivot points: 24,642, 24,669, and 24,712
Support based on pivot points: 24,555, 24,528, and 24,484
Special Formation: The Nifty formed a small bullish candle on the daily chart, following the long bearish candle from the previous session. The index remained below short-term moving averages (10-day and 20-day EMAs), though it is still above the medium- and long-term moving averages. The Relative Strength Index (RSI) stayed above the neutral 50 mark, closing at 52.34. The Stochastic RSI is on the verge of a positive crossover. The MACD continued with a negative crossover and a weak histogram, although it stayed well above the zero line.
2) Key Levels For The Bank Nifty (55,677)
Resistance based on pivot points: 55,772, 55,862, and 56,008
Support based on pivot points: 55,479, 55,389, and 55,243
Resistance based on Fibonacci retracement: 56,307, 58,648
Support based on Fibonacci retracement: 54,117, 52,892
Special Formation: The Bank Nifty formed a Doji-like candlestick pattern on the daily timeframe, following the bearish candle of the previous session. This signals indecision among buyers and sellers, ahead of the RBI MPC interest rate decision. The index remained above all key moving averages and stayed above the midline of the Bollinger Bands, accompanied by an expansion of the upper band. The RSI hovered around the 60 mark, ending at 59.65. The MACD maintained its position well above the zero line, despite a negative crossover and minor weakness in the histogram.
3) Nifty Call Options Data
According to the weekly options data, the maximum Call open interest was seen at the 25,500 strike (with 1.53 crore contracts). This level can act as a key resistance for the Nifty in the short term. It was followed by the 25,000 strike (1.38 crore contracts), and the 24,600 strike (1.03 crore contracts).
Maximum Call writing was observed at the 24,600 strike, which saw an addition of 28.39 lakh contracts, followed by the 24,700 and 25,200 strikes, which added 16.75 lakh and 15.15 lakh contracts, respectively. The maximum Call unwinding was seen at the 25,700 strike, which shed 11.17 lakh contracts, followed by the 25,500 and 24,800 strikes which shed 7.61 lakh and 7.52 lakh contracts, respectively.
4) Nifty Put Options Data
On the Put side, the 24,000 strike holds the maximum Put open interest (with 98.12 lakh contracts), which can act as a key support level for the Nifty. It was followed by the 24,600 strike (96.26 lakh contracts) and the 24,500 strike (87.89 lakh contracts).
The maximum Put writing was placed at the 24,600 strike, which saw an addition of 39.74 lakh contracts, followed by the 24,500 and 24,000 strikes, which added 33.59 lakh and 22.06 lakh contracts, respectively. The Put unwinding was seen at the 24,800 strike, which shed 7.28 lakh contracts, followed by the 25,000 and 24,750 strikes which shed 2.55 lakh and 2.27 lakh contracts, respectively.
5) Bank Nifty Call Options Data
According to the monthly options data, the maximum Call open interest was placed at the 56,000 strike, with 22.37 lakh contracts. This can act as a key resistance level for the index in the short term. It was followed by the 57,000 strike (10.22 lakh contracts) and the 55,000 strike (6.13 lakh contracts).
Maximum Call writing was visible at the 57,000 strike (with the addition of 96,630 contracts), followed by the 56,500 strike (61,620 contracts), and the 55,700 strike (39,030 contracts). The maximum Call unwinding was seen at the 57,200 strike, which shed 19,410 contracts, followed by the 55,500 and 57,400 strikes, which shed 19,140 and 6,990 contracts, respectively.
6) Bank Nifty Put Options Data
On the Put side, the 56,000 strike holds the maximum Put open interest (with 16.87 lakh contracts), which can act as a key level for the index. This was followed by the 55,000 strike (11.05 lakh contracts) and the 54,000 strike (8.12 lakh contracts).
The maximum Put writing was observed at the 55,500 strike (which added 1.14 lakh contracts), followed by the 55,000 strike (81,600 contracts) and the 56,000 strike (49,380 contracts). The maximum Put unwinding was seen at the 56,300 strike, which shed 7,740 contracts, followed by the 56,100 and 56,200 strikes, which shed 7,470 and 5,760 contracts, respectively.
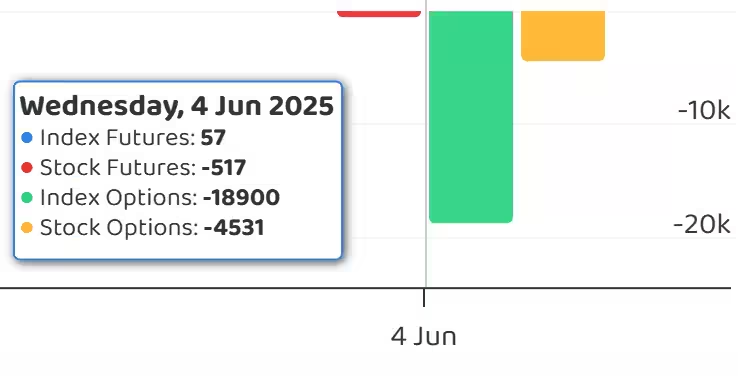
7) Funds Flow (Rs crore)
8) Put-Call Ratio
The Nifty Put-Call ratio (PCR), which indicates the mood of the market, rose to 0.73 on June 4, from 0.65 in the previous session.
The increasing PCR, or being higher than 0.7 or surpassing 1, means traders are selling more Put options than Call options, which generally indicates the firming up of a bullish sentiment in the market. If the ratio falls below 0.7 or moves towards 0.5, then it indicates selling in Calls is higher than selling in Puts, reflecting a bearish mood in the market.
9) India VIX
The India VIX, which measures expected market volatility, cooled down for a second consecutive session, falling 4.89 percent to 15.75. This decline provides some comfort for bulls. For further confidence, the VIX needs to drop below 15 levels.
10) Long Build-up (93 Stocks)
A long build-up was seen in 93 stocks. An increase in open interest (OI) and price indicates a build-up of long positions.

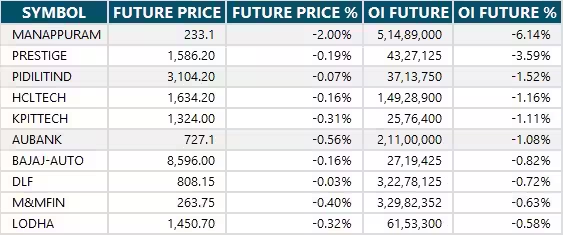
11) Long Unwinding (15 Stocks)
15 stocks saw a decline in open interest (OI) along with a fall in price, indicating long unwinding.
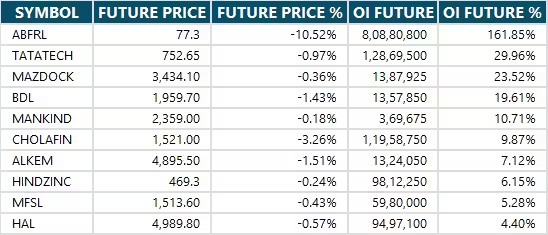
12) Short Build-up (58 Stocks)
58 stocks saw an increase in OI along with a fall in price, indicating a build-up of short positions.
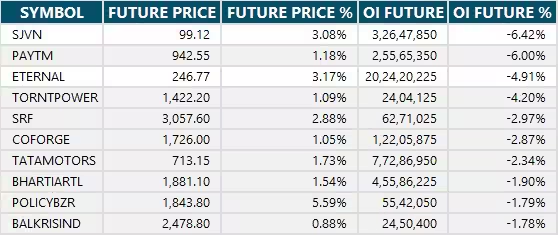
13) Short-Covering (59 Stocks)
59 stocks saw short-covering, meaning a decrease in OI, along with a price increase.
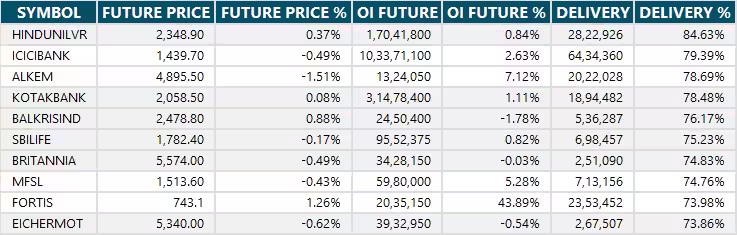
14) High Delivery Trades
Here are the stocks that saw a high share of delivery trades. A high share of delivery reflects investing (as opposed to trading) interest in a stock.
15) Stocks Under F&O Ban
Securities banned under the F&O segment include companies where derivative contracts cross 95 percent of the market-wide position limit.
Stocks added to F&O ban: Aditya Birla Fashion and Retail
Stocks retained in F&O ban: Manappuram Finance
Stocks removed from F&O ban: Nil


0 Comment