24 Jun , 2024 By : Debdeep Gupta

Jigar S Patel, Senior Manager - Equity Research at Anand Rathi
The past week (ended June 21) was shortened but filled with significant activity in the broader markets. The Nifty 50 index reached a new high above 23,600 but ended the week flat. Meanwhile, the Midcap and Smallcap 100 indices outperformed the benchmark. Sector-wise, banking, sugar, and fertilizers led the way.
From a technical perspective, we are seeing peak index management. Since the notable green candle on June 7, 2024, the Nifty 50 has been inching higher but closing in the red, with nine consecutive indecisive red candles. This pattern may not bode well for the markets in the coming sessions. A close below 23,300 would indicate a breakout failure, potentially leading to significant profit booking. Therefore, traders should maintain a strict stop-loss at 23,300 for their long positions. On the upside, the index may continue its gradual rise above the 23,700 mark, though this appears unlikely at the moment.
Regarding the Nifty Bank index, we saw much-anticipated short covering, with the index outperforming the benchmarks and rallying over 3 percent to 51,661. Technically, the index broke through the rising trendline resistance. However, a breach of the 51,000 mark on a closing basis would indicate a failure of this breakout. The upside hurdle is at 52,000, and below 51,000, we might see profit booking in banking stocks as well.
Here are three buy calls for the short term:
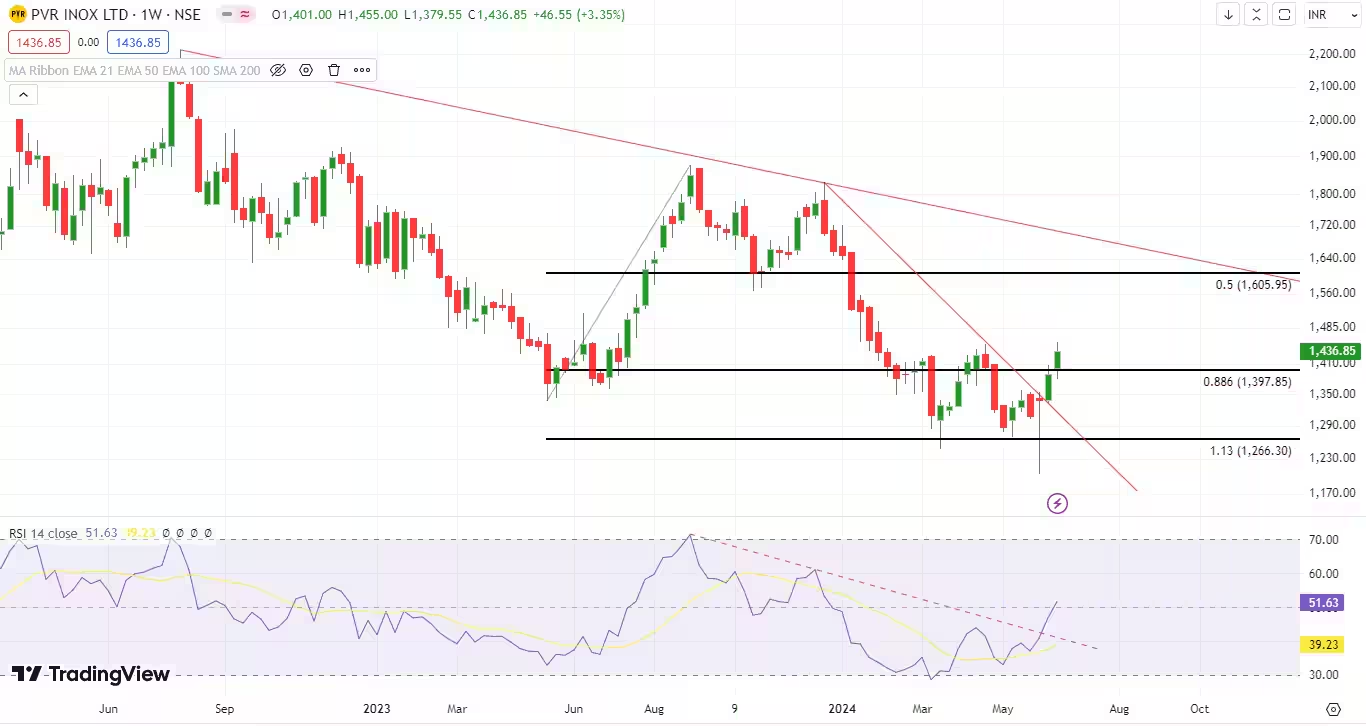
PVR INOX | CMP: Rs 1,436.85

PVR INOX has recently exhibited two significant technical analysis signals that indicate a potential bullish shift. Firstly, there is a bullish divergence on the weekly Relative Strength Index (RSI) near the 30 level. This divergence suggests that while the stock price was declining, the RSI was starting to increase, indicating a possible reversal in momentum. Secondly, the stock has broken through a bearish trend line of RSI weekly that had been in place for approximately 7 months. This trendline breach is a critical signal, suggesting that the long-term bearish trend may be reversing to a bullish trend. Based on these technical indicators, investors and traders are advised to "go long" on PVR INOX, purchasing shares within the price range of Rs 1,415-1,440. The stock is projected to have an upside target of Rs 1,575 per share, highlighting a significant profit potential. To mitigate risk, it is recommended to place a stop-loss near Rs 1,350 on a daily closing basis, ensuring protection against potential adverse movements.
Strategy: Buy
Target: Rs 1,575
Stop-Loss: Rs 1,350
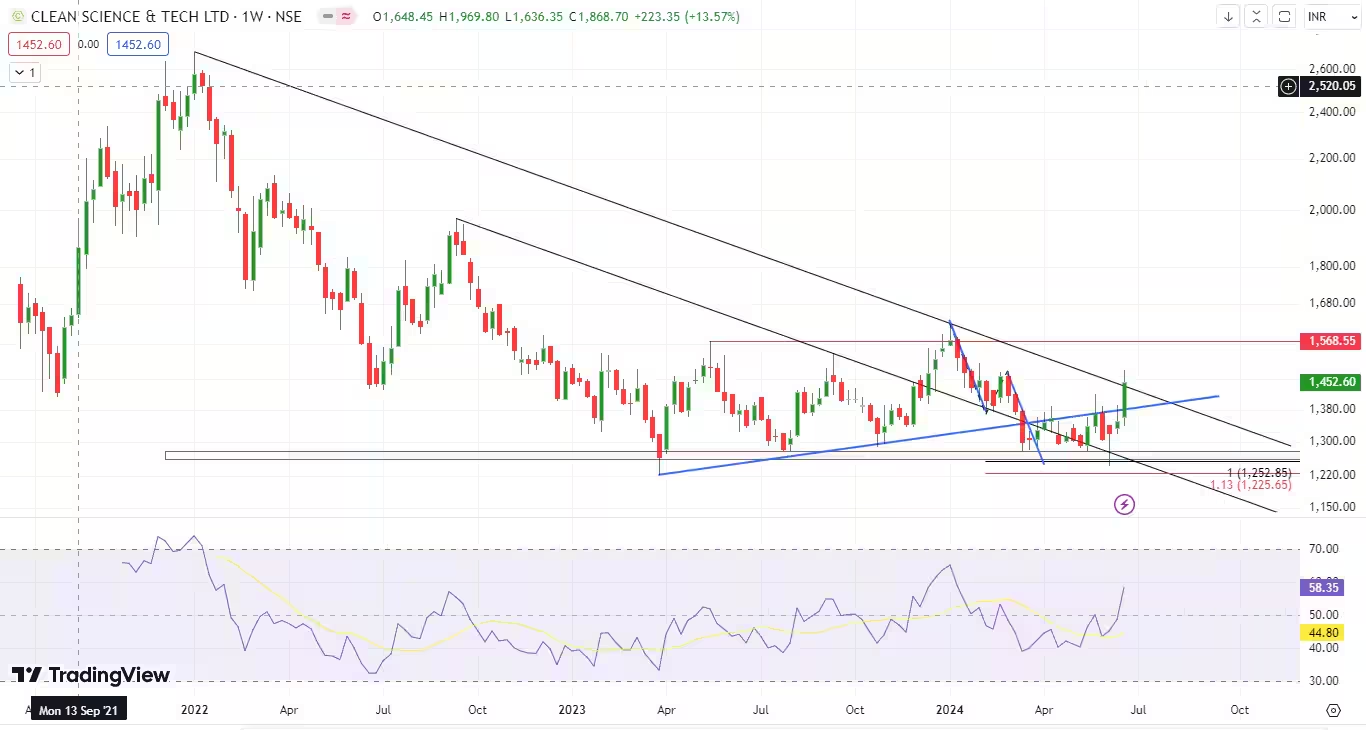
Clean Science and Technology | CMP: Rs 1,452.6

Since March 2023, Clean Science has demonstrated remarkable stability by consistently maintaining its price range between Rs 1,230 and Rs 1,250. Over this period, the stock has formed approximately five to six bottoms within this level, indicating strong support and resilience at these prices. In the last trading week, a significant technical signal appeared in the form of a classic Hammer candlestick pattern near the established support zone. This pattern is often seen as a bullish reversal signal, suggesting potential upward movement. Furthermore, technical indicators support this bullish outlook: the weekly Relative Strength Index (RSI) has begun to chart higher highs and higher lows, a pattern indicative of strengthening bullish sentiment. Given these technical factors, we recommend initiating long positions within the price range of Rs 1,430 - Rs 1,460.
Strategy: Buy
Target: Rs 1,575
Stop-Loss: Rs 1,225
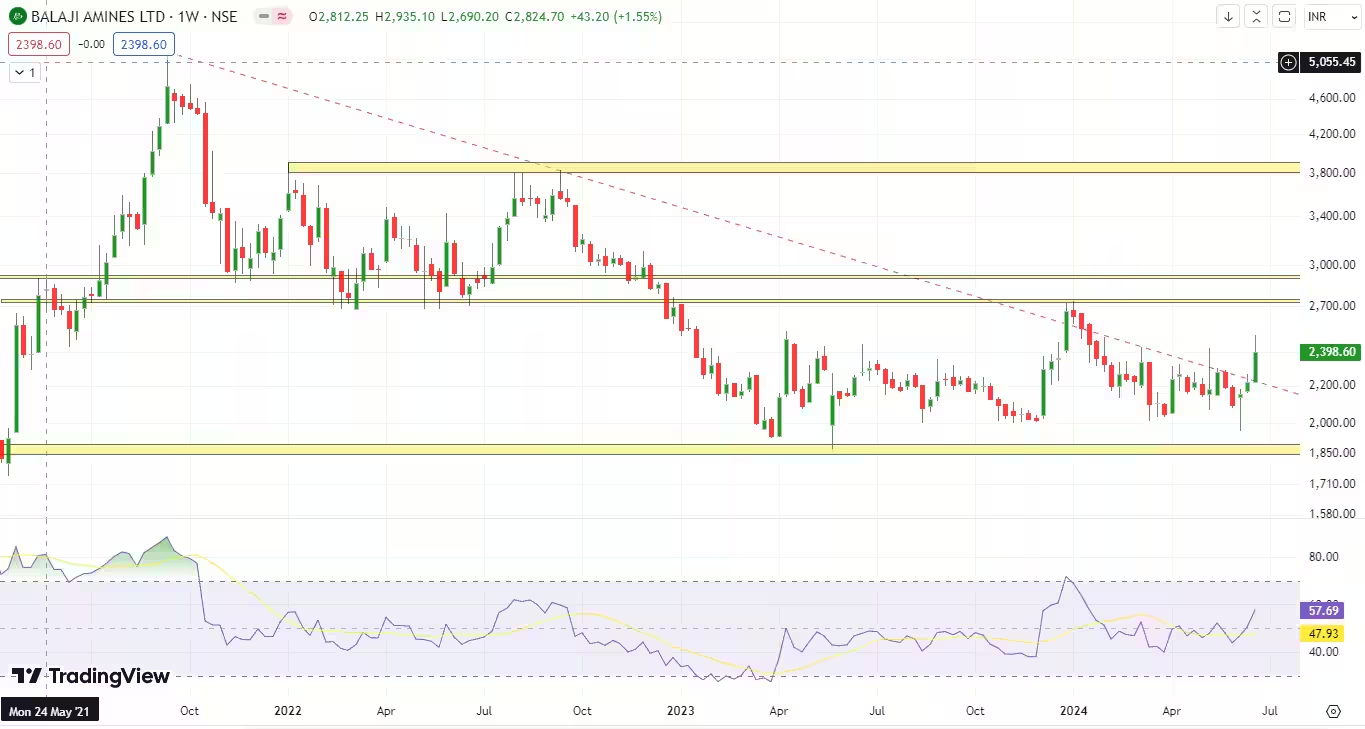
Balaji Amines | CMP: Rs 2,398.6

Balaji Amines has recently exhibited two significant technical analysis signals that indicate a potential bullish shift. Firstly, there is a bullish divergence on the weekly RSI near the 40 level. This divergence suggests that while the stock's price was declining, the RSI was starting to increase, indicating a possible reversal in momentum. Secondly, the stock has broken through a bearish trendline that had been in place for approximately 2.75 years. This trendline breach is a critical signal, suggesting that the long-term bearish trend may be reversing to a bullish trend. Based on these technical indicators, investors and traders are advised to "go long" on Balaji Amines within the price range of Rs 2,375-2,400. The stock is projected to have an upside target of Rs 2,760 per share, highlighting significant profit potential. To mitigate risk, it is recommended to place a stop-loss near Rs 2,200 on a daily closing basis, ensuring protection against potential adverse movements.
Strategy: Buy
Target: Rs 2,760
Stop-Loss: Rs 2,200
0 Comment