02 Sep , 2025 By : Debdeep Gupta

The market rebounded sharply after a three-day correction, taking support at the rising trendline (24,420) and finishing 0.81 percent higher on September 1, marking a good start to the week. Overall, the sentiment remains bearish, and the sustainability of this rally is key to watch. The index reached close to the 100-day EMA (24,630), which is crucial for a further upward move toward the 24,700–24,800 levels. Sustaining above this level can drive the index toward the 25,000 mark. However, a decisive fall below the 24,420 level could open the door for a retest of the August low of 24,330, according to experts.
Here are 15 data points we have collated to help you spot profitable trades:
1) Key Levels For The Nifty 50 (24,625)
Resistance based on pivot points: 24,642, 24,690, and 24,767
Support based on pivot points: 24,487, 24,439, and 24,362
Special Formation: The Nifty 50 formed a long bullish candle on the daily timeframe, negating the lower highs of the previous six consecutive sessions. The index surpassed the 100-day EMA intraday and closed just below it. It is still well below the 10-, 20-, and 50-day EMAs. The RSI moved upward to 45.5, while the MACD still showed a negative crossover. The MACD histogram remains below the zero line, although the weakness has faded. This indicates a potential shift in momentum, but confirmation is awaited.
2) Key Levels For The Bank Nifty (54,002)
Resistance based on pivot points: 54,043, 54,132, and 54,277
Support based on pivot points: 53,754, 53,665, and 53,521
Resistance based on Fibonacci retracement: 54,548, 55,135
Support based on Fibonacci retracement: 53,428, 52,430
Special Formation: The Bank Nifty also bounced back after five days of selling pressure and defended the previous day’s low. The index traded within the previous day’s range and formed a green candle on the daily timeframe, though it remains below the 20-, 50-, and 100-day EMAs. The RSI showed an uptick toward 33.39 but maintained a bearish crossover. The MACD also stayed in a negative crossover, and the histogram remained below the zero line. This indicates persistent weakness, despite the intraday recovery.
3) Nifty Call Options Data
According to the weekly options data, the 25,000 strike holds the maximum Call open interest (with 1.76 crore contracts). This level can act as a key resistance for the Nifty in the short term. It was followed by the 24,800 strike (1.18 crore contracts), and the 24,700 strike (1.11 crore contracts).
Maximum Call writing was observed at the 24,650 strike, which saw an addition of 33.41 lakh contracts, followed by the 24,800 and 24,750 strikes, which added 19.09 lakh and 16.08 lakh contracts, respectively. The maximum Call unwinding was seen in the 24,500 strike, which shed 80.06 lakh contracts, followed by the 25,500 and 24,600 strikes, which shed 51.39 lakh and 43.86 lakh contracts, respectively.
4) Nifty Put Options Data
On the Put side, the maximum Put open interest was seen at the 24,500 strike (with 1.95 crore contracts), which can act as a key support level for the Nifty. It was followed by the 24,600 strike (1.45 crore contracts) and the 24,000 strike (1.24 crore contracts).
The maximum Put writing was placed at the 24,500 strike, which saw an addition of 1.4 crore contracts, followed by the 24,600 and 24,550 strikes, which added 1.23 crore and 1.02 crore contracts, respectively. The maximum Put unwinding was seen at the 24,900 strike, which shed 98,100 contracts, followed by the 24,800 and 25,200 strikes, which shed 97,950 and 88,800 contracts, respectively.
5) Bank Nifty Call Options Data
According to the monthly options data, the maximum Call open interest was seen at the 56,000 strike, with 12.33 lakh contracts. This can act as a key resistance level for the index in the short term. It was followed by the 55,000 strike (11.37 lakh contracts) and the 54,000 strike (9.01 lakh contracts).
Maximum Call writing was observed at the 55,000 strike (with the addition of 81,235 contracts), followed by the 54,200 strike (60,095 contracts), and the 55,200 strike (28,910 contracts). The maximum Call unwinding was seen at the 53,700 strike, which shed 17,710 contracts, followed by the 55,100 and 54,400 strikes, which shed 10,045 and 6,790 contracts, respectively.
6) Bank Nifty Put Options Data
On the Put side, the 54000 strike holds the maximum Put open interest (with 12.48 lakh contracts), which can act as a key support level for the index. This was followed by the 53,000 strike (7.98 lakh contracts) and the 55,000 strike (7.25 lakh contracts).
The maximum Put writing was observed at the 54,000 strike (which added 1.7 lakh contracts), followed by the 53,800 strike (71,715 contracts) and the 53,500 strike (65,870 contracts). The maximum Put winding was seen at the 56,000 strike, which shed 23,100 contracts, followed by the 55,500 and 55,200 strikes, which shed 8,455 and 1,960 contracts, respectively.
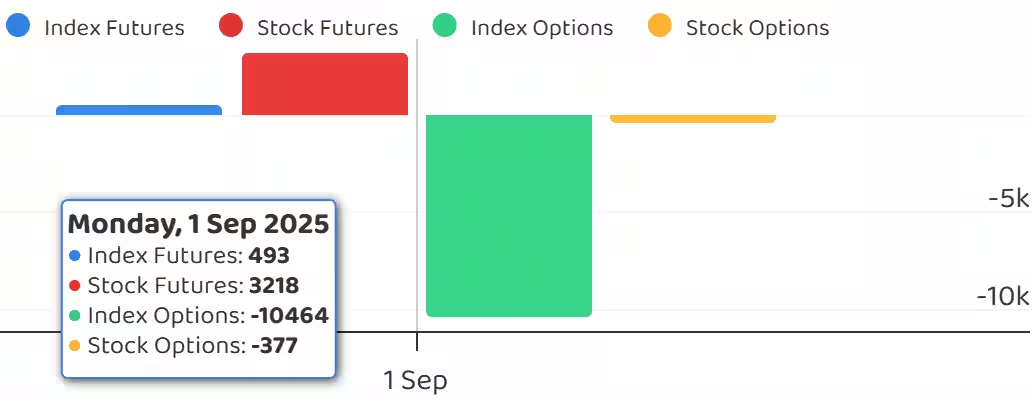
7) Funds Flow (Rs crore)
8) Put-Call Ratio
The Nifty Put-Call ratio (PCR), which indicates the mood of the market, spiked to 1.14 on September 01, compared to 0.71 in the previous session.
The increasing PCR, or being higher than 0.7 or surpassing 1, means traders are selling more Put options than Call options, which generally indicates the firming up of a bullish sentiment in the market. If the ratio falls below 0.7 or moves towards 0.5, then it indicates selling in Calls is higher than selling in Puts, reflecting a bearish mood in the market.
9) India VIX
The India VIX, which measures expected market volatility, dropped sharply further to 11.29, down 3.91 percent, and is now trading below all key moving averages. This indicates a less uncertain environment for the market; however, participants need to remain cautious, as the possibility of a sharp move in either direction cannot be ruled out.
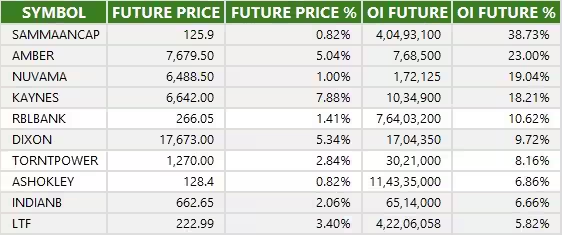
10) Long Build-up (123 Stocks)
A long build-up was seen in 123 stocks. An increase in open interest (OI) and price indicates a build-up of long positions.
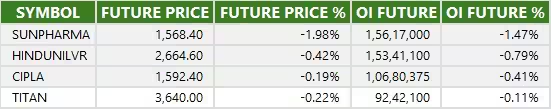
11) Long Unwinding (4 Stocks)
4 stocks saw a decline in open interest (OI) along with a fall in price, indicating long unwinding.
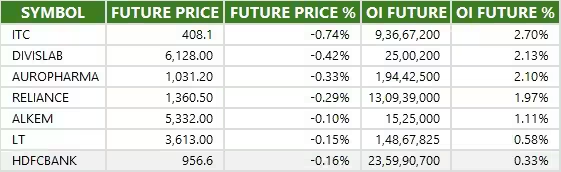
12) Short Build-up (7 Stocks)
7 stocks saw an increase in OI along with a fall in price, indicating a build-up of short positions.
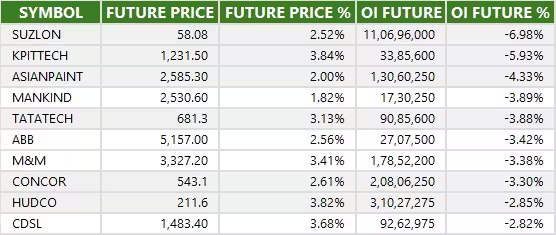
13) Short-Covering (79 Stocks)
79 stocks saw short-covering, meaning a decrease in OI, along with a price increase.
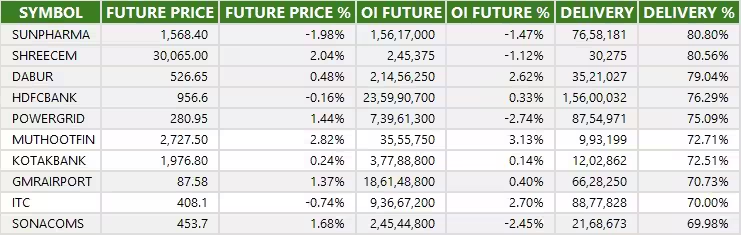
14) High Delivery Trades
Here are the stocks that saw a high share of delivery trades. A high share of delivery reflects investing (as opposed to trading) interest in a stock.
15) Stocks Under F&O Ban
Securities banned under the F&O segment include companies where derivative contracts cross 95 percent of the market-wide position limit.
Stocks added to F&O ban: Nil
Stocks retained in F&O ban: Nil
Stocks removed from F&O ban: Nil


0 Comment